PEPE Price Gains Momentum — Will Bullish Momentum Continue?
BITmarkets Team
Oct 21, 2026

The latest rebound has pushed PEPE back above the 0.5 Fibonacci retracement near $0.0000042813, improving the short-term technical picture. With the token now trading around $0.00000454, attention is shifting toward whether buyers can maintain momentum and challenge the September highs.
PEPE technical analysis
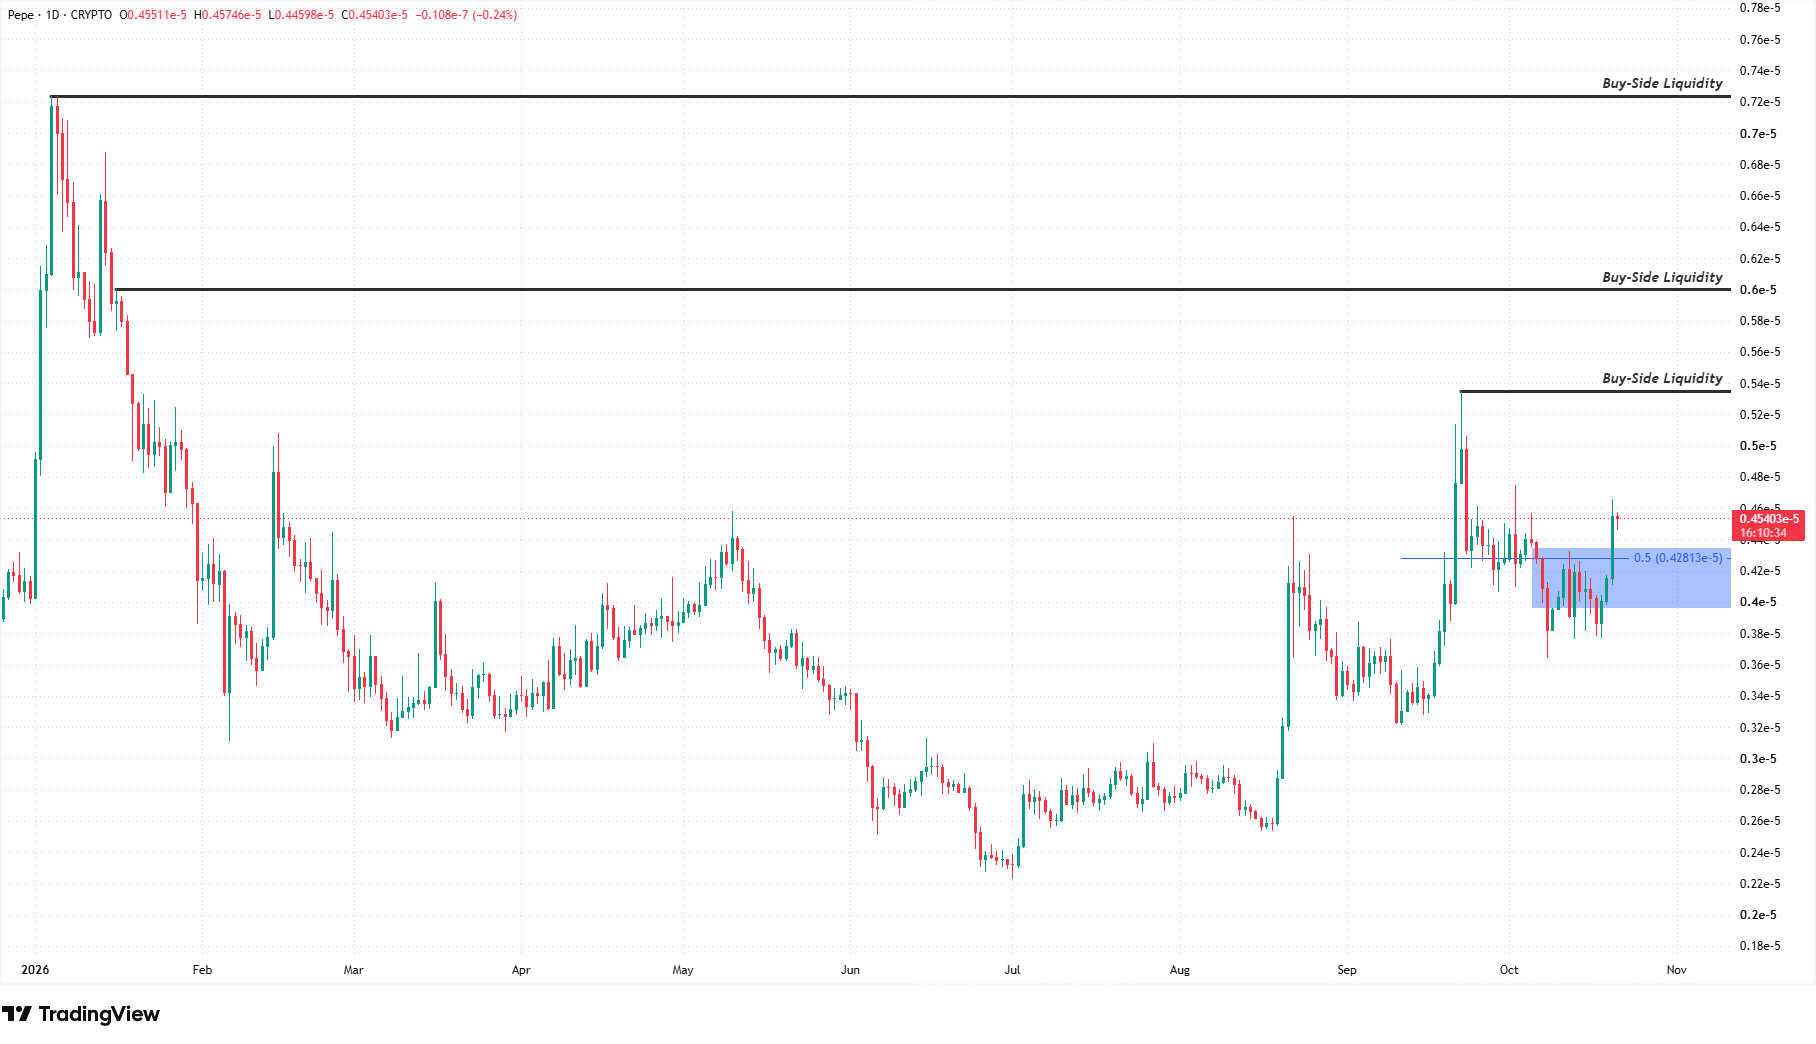
PEPEUSD - 1 Day Time Frame
The recent correction brought PEPE into a daily support zone between approximately $0.00000395 and $0.00000435. This area also contains the 0.5 Fibonacci retracement near $0.0000042813, making it particularly important within the current structure. After several sessions of fluctuating price action inside the zone, buyers produced a strong bullish candle that carried PEPE back toward $0.0000046.
The recovery above the Fibonacci midpoint suggests improving buyer momentum and could indicate that the corrective phase is beginning to lose strength. Maintaining price above this area may help preserve the current recovery structure. The $0.00000395–$0.00000435 zone remains the main support area for the bullish scenario. A sustained daily move below its lower boundary could weaken the latest recovery and increase the possibility of renewed downside pressure.
Conversely, continued strength above the 0.5 Fibonacci level could keep the broader recovery intact and allow buyers to focus on the resistance levels above.
PEPE price target
With PEPE currently trading around $0.00000454, the first major upside target is located near $0.0000054, corresponding with the September high and an important Buy-Side Liquidity area. A sustained move above this level could strengthen the short-term bullish structure and open the way toward higher targets.
The next Buy-Side Liquidity area is positioned around $0.000006, followed by a higher target near $0.0000072. These levels could serve as potential Take Profit areas if bullish momentum continues to develop. On the downside, the key area to monitor remains $0.00000395–$0.00000435, with the 0.5 Fibonacci level near $0.0000042813 particularly important.
For now, continued strength above the Fibonacci midpoint could keep $0.0000054 in focus, followed by $0.000006 and $0.0000072 if momentum strengthens further. A sustained break below the support zone, however, could weaken the recovery and increase the likelihood of another corrective move.
Crypto assets are unregulated, decentralised and highly volatile assets which entail substantial risks and you may lose all invested capital. Refer to the Disclaimers for detailed information on potential risks.