Ethereum (ETH) Price Eyes Higher Levels — Can It Reach $2,500?
BITmarkets Team
Nov 02, 2026

Following the latest decline toward $2,180, Ethereum has recovered to around $2,286 and is now testing an important resistance area. The reaction around this zone could help determine whether buyers can extend the recovery or whether the broader correction remains in control.
Ethereum (ETH) technical analysis
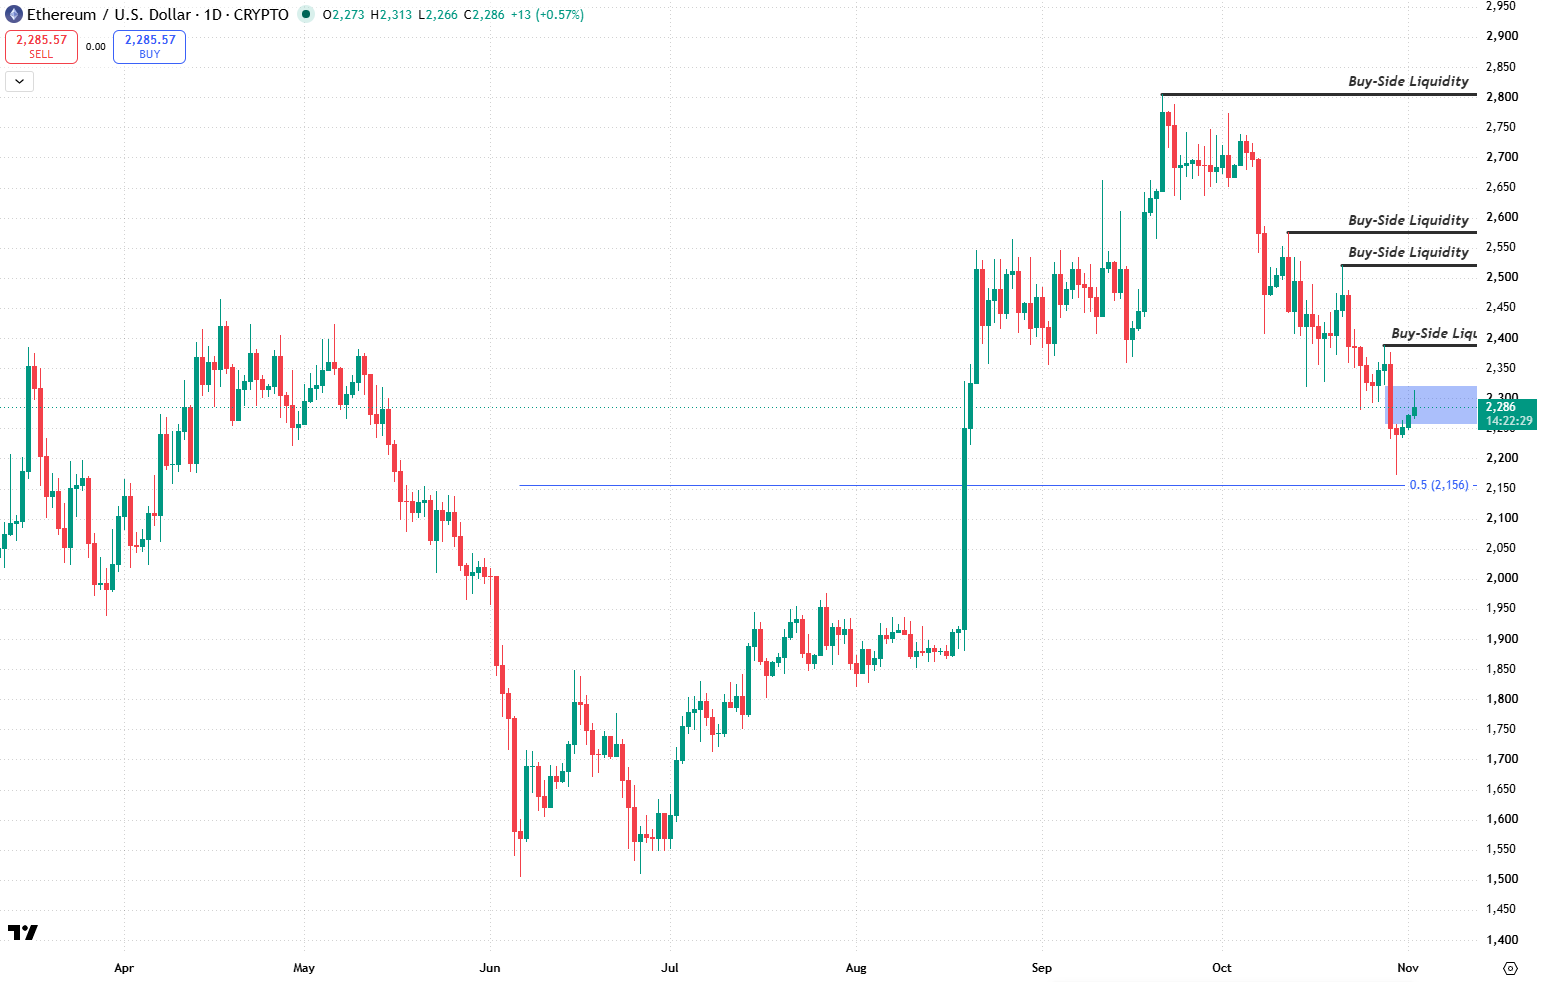
ETHUSD - 1 Day Time Frame
The decline from the September high has been accompanied by progressively lower price peaks, initially around $2,575, followed by $2,520 and subsequently $2,390. This sequence suggests that sellers continue to hold an advantage within the short-term structure.
The latest recovery has brought Ethereum into the resistance zone between approximately $2,255 and $2,320. This area could act as an important barrier following the recent bearish move. A rejection from the zone could reinforce the existing downside pressure, while a sustained daily close above its upper boundary could indicate improving buyer activity and strengthen the short-term recovery.
The 0.5 Fibonacci retracement around $2,156 remains an important technical reference below the current market. Ethereum approached this level during the latest decline, although buyers managed to produce a recovery before the price reached it.
If the current resistance limits further upside, another move toward $2,156 could remain technically relevant. The reaction around this Fibonacci level may provide further insight into the strength of the broader recovery structure established during the summer.
Ethereum (ETH) price target
The nearest Buy-Side Liquidity target is located around $2,390, corresponding with the latest significant lower high. A sustained recovery above the current $2,255–$2,320 resistance zone could create room for another attempt toward this level.
Additional Buy-Side Liquidity remains around $2,520, $2,575, and $2,800. These higher levels could become increasingly relevant if Ethereum continues to strengthen and gradually breaks the sequence of lower highs formed during October.
For now, the $2,255–$2,320 area remains the key resistance zone to monitor. A sustained move above it could improve the short-term outlook and bring $2,390 back into focus, followed by $2,520, $2,575, and potentially $2,800 if bullish momentum strengthens further.
Conversely, another rejection from resistance could shift attention back toward the $2,156 Fibonacci level, which remains the main technical reference below the current price.
Crypto assets are unregulated, decentralised and highly volatile assets which entail substantial risks and you may lose all invested capital. Refer to the Disclaimers for detailed information on potential risks.