Gọi video, điện thoại và email 24/7 bằng hơn 15 ngôn ngữ
99% quỹ
trong ví lạnh để giữ cho tài sản của bạn an toàn
1 phút
đăng ký để bắt đầu rất đơn giản
Đây là phí giao dịch gần như bằng không với BTMT!
BTMT đã phát huy hết tiềm năng phát triển khi nó hiện chính thức được niêm yết dưới dạng tiền mã hoá độc lập trên sàn giao dịch mua bán và trao đổi của chúng tôi.
BITmarkets tự hào hỗ trợ các vận động viên tài năng. Làm việc chăm chỉ thường là yếu tố quan trọng nhất, và luôn tuyệt vời khi có ai đó đứng sau ủng hộ bạn. Chúng tôi làm việc với một số tài năng lớn nhất trong các môn thể thao của họ và giúp đỡ họ trên hành trình đến vinh quang và chiến thắng. Đây là mục tiêu chính mà chúng tôi hướng tới để đạt được cùng nhau.
Chúng tôi hiểu rằng không có ai là giống nhau. Mỗi nhà giao dịch là duy nhất và BITmarkets mang tới giải pháp cho tất cả mọi người. Bạn là kiểu nhà đầu tư nào?
Mua và bán tiền điện tử chưa bao giờ dễ dàng hơn thế. Chúng tôi cung cấp cho bạn các công cụ để đa dạng hóa bằng cách giao dịch trực quan, nhanh chóng và an toàn với hơn 200 loại tiền điện tử. Cảm thấy choáng ngợp? Chúng tôi sẽ hỗ trợ bạn như không có ai khác. Theo nghĩa đen, đường dây của chúng tôi luôn sẵn sàng hỗ trợ ngôn ngữ bạn chọn.
Hơn 99% tài sản được lưu trữ trong ví lạnh, Whitelisting và xác nhận giao dịch cũng như dữ liệu cá nhân được mã hóa để giữ an toàn cho tài sản của bạn.
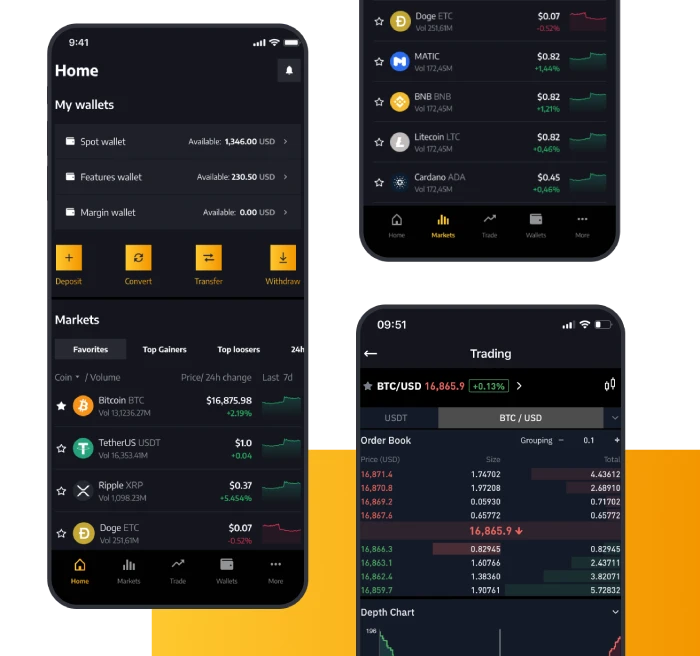
Giao dịch trao ngay
Giao dịch trên một trong những thị trường giao ngay linh hoạt nhất. Tận hưởng một trải nghiệm giao dịch suôn sẻ với sổ lệnh "Tất cả trong một" cho thanh khoản cao hơn, chênh lệch thấp hơn và nhiều cặp tiền hơn.
Tuỳ chọn Hợp đồng tương lai độc đáo
BITmarkets Futures được nâng cấp đang mang đến một cuộc cách mạng trong giao dịch hợp đồng tương lai Bitcoin khi cho phép ký quỹ và thanh toán đa tài sản. Mở ra những khả năng vô song với danh mục đầu tư của bạn.
Hơn 200 loại tiền mã hoá
Chọn từ hơn 200 loại tiền mã hoá được hỗ trợ như Bitcoin, Ethereum, ChainLink, Dogecoin, Cardano và SHIBA INU trong khi luôn ở tuyến đầu trong việc cập nhật ra mắt các đồng tiền mới.
Hỗ trợ 24/7
Khi chúng tôi nói rằng chúng tôi trò chuyện bằng tiền mã hoá, chúng tôi thực lòng có ý như vậy. Đường dây hỗ trợ của chúng tôi hoạt động liên tục với hơn 20 ngôn ngữ, vì vậy hãy yên tâm rằng chúng tôi luôn chăm sóc tốt khách hàng của mình.
Giao dịch nhanh như chớp
Quên FOMO đi. Chúng tôi xử lý hơn 1 triệu yêu cầu mỗi giây nên chúng tôi xử lý giao dịch của bạn ngay khi bạn quyết định thực hiện nó.
Bảo mật cấp tổ chức
Hơn 99% tài sản được lưu trữ trong ví lạnh, Whitelisting và xác nhận giao dịch cũng như dữ liệu cá nhân được mã hóa để giữ an toàn cho tài sản của bạn.
Giao dịch trao ngay
Giao dịch trên một trong những thị trường giao ngay linh hoạt nhất. Tận hưởng một trải nghiệm giao dịch suôn sẻ với sổ lệnh "Tất cả trong một" cho thanh khoản cao hơn, chênh lệch thấp hơn và nhiều cặp tiền hơn.
Tuỳ chọn Hợp đồng tương lai độc đáo
BITmarkets Futures được nâng cấp đang mang đến một cuộc cách mạng trong giao dịch hợp đồng tương lai Bitcoin khi cho phép ký quỹ và thanh toán đa tài sản. Mở ra những khả năng vô song với danh mục đầu tư của bạn.
Hơn 200 loại tiền mã hoá
Chọn từ hơn 200 loại tiền mã hoá được hỗ trợ như Bitcoin, Ethereum, ChainLink, Dogecoin, Cardano và SHIBA INU trong khi luôn ở tuyến đầu trong việc cập nhật ra mắt các đồng tiền mới.
Hỗ trợ 24/7
Khi chúng tôi nói rằng chúng tôi trò chuyện bằng tiền mã hoá, chúng tôi thực lòng có ý như vậy. Đường dây hỗ trợ của chúng tôi hoạt động liên tục với hơn 20 ngôn ngữ, vì vậy hãy yên tâm rằng chúng tôi luôn chăm sóc tốt khách hàng của mình.
Giao dịch nhanh như chớp
Quên FOMO đi. Chúng tôi xử lý hơn 1 triệu yêu cầu mỗi giây nên chúng tôi xử lý giao dịch của bạn ngay khi bạn quyết định thực hiện nó.
Chúng tôi đang mang tiền điện tử đến MỌI NGƯỜI. Việc mua, bán và giao dịch giờ đây trở nên đơn giản và an toàn hơn bao giờ hết. Với ứng dụng siêu nhanh của chúng tôi, giờ đây bạn có thể luôn đứng đầu trò chơi của mình.
Mới biết về tiền mã hoá?
Kiến thức là sức mạnh. Chúng tôi cung cấp cho bạn các công cụ để có thêm kiến thức về tiền mã hoá và giao dịch như một chuyên gia thực thụ.