Starknet (STRK) Price Outlook: Can It Double in 2026?
BITmarkets Team
Oct 28, 2026

The decline has also taken STRK below a support area that helped form the base of the October rally. With the price now consolidating near recent lows, the next move could depend on whether buyers can reclaim nearby resistance or whether selling pressure extends toward lower support.
Starknet (STRK) technical analysis
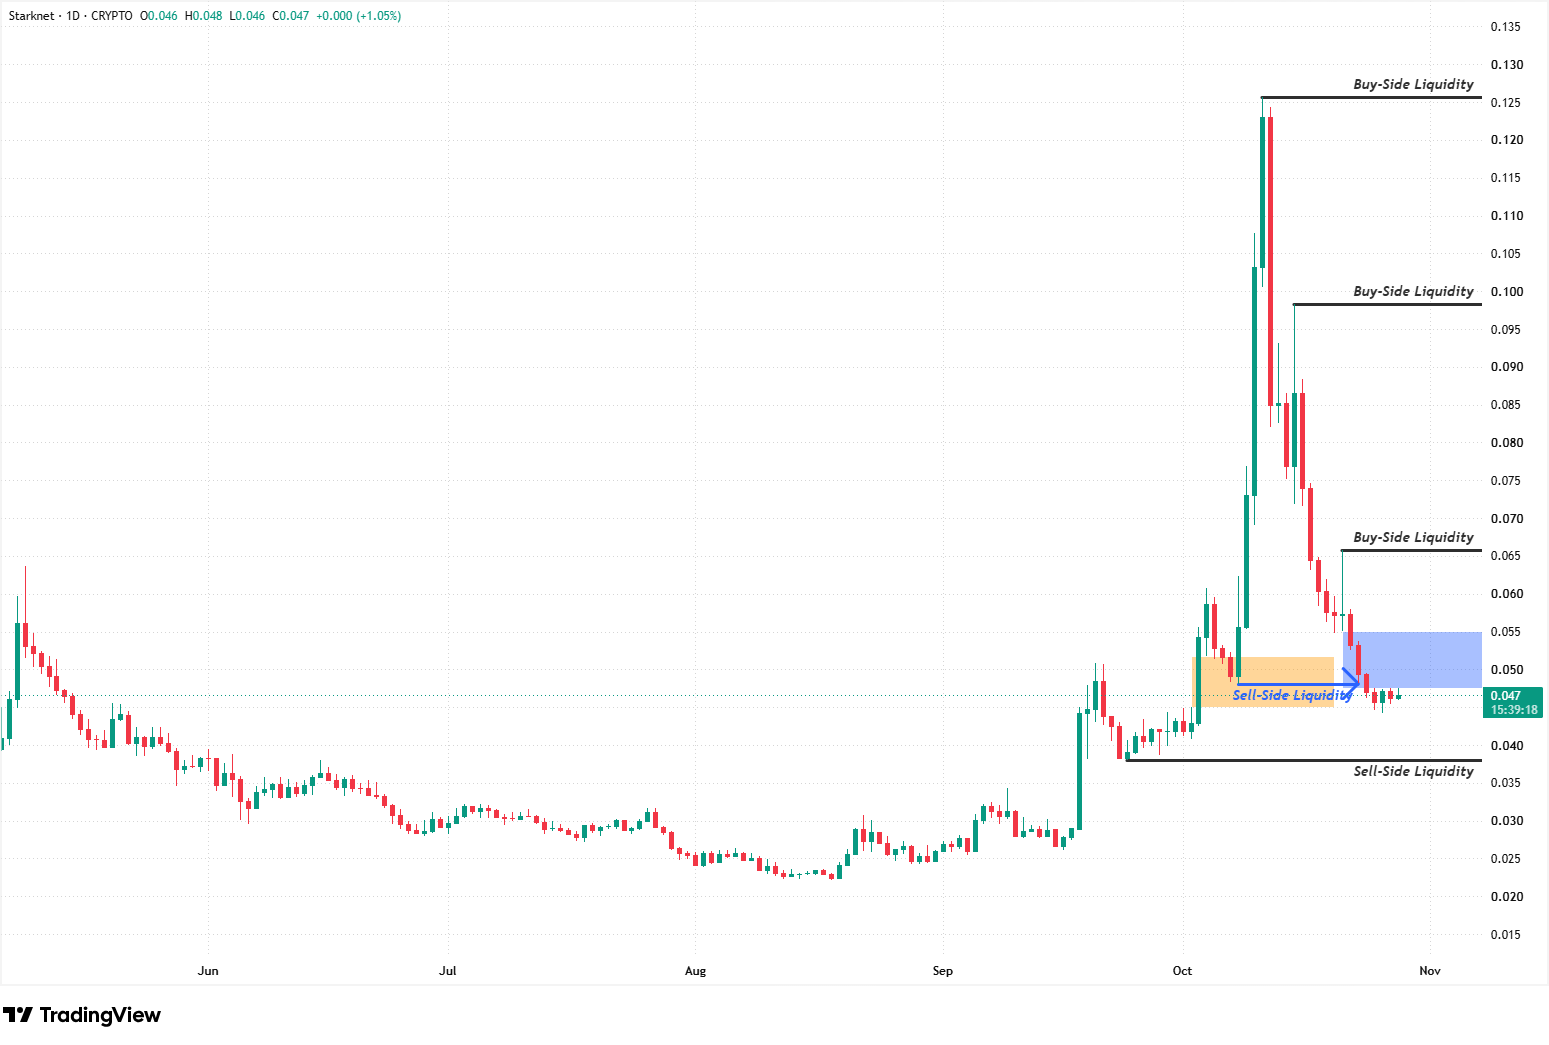
STRKUSD - 1 Day Time Frame
The zone between approximately $0.048 and $0.052 previously represented an important area of buying interest. During the latest decline, however, STRK moved through this structure and swept Sell-Side Liquidity near its lower boundary. The price has subsequently settled below the broader resistance zone extending approximately from $0.047 to $0.055. This area could now act as resistance during a recovery, particularly after the strong bearish candles that accompanied the breakdown.
Recent daily candles show that the decline has temporarily slowed around $0.046, although a convincing bullish reaction has yet to develop. The relatively narrow price action suggests short-term stabilization following the previous period of heavy selling.
A sustained recovery above the $0.047–$0.055 resistance zone, particularly above its upper boundary near $0.055, could improve the short-term structure. Until stronger buying activity emerges, however, the latest consolidation offers limited evidence of a sustained bullish reversal.
Starknet (STRK) price target
Another important Sell-Side Liquidity level is positioned around $0.038, below the September price structure. Continued bearish pressure could bring this area into focus as the next potential downside target. On the upside, the nearest Buy-Side Liquidity is located around $0.065. Higher reference levels remain near $0.098 and $0.125, although reaching these areas would likely require a significantly stronger recovery than the market is currently showing.
The immediate technical focus remains on the reaction around $0.047–$0.055. Failure to recover this zone could keep the bearish scenario intact and leave $0.038 relevant as the next downside target. Conversely, a sustained move back above resistance could improve the short-term outlook and create room for a recovery toward the first Buy-Side Liquidity level around $0.065.
Crypto assets are unregulated, decentralised and highly volatile assets which entail substantial risks and you may lose all invested capital. Refer to the Disclaimers for detailed information on potential risks.