Huma Finance (HUMA) Price Eyes Breakout Above $0.030
BITmarkets Team
Oct 27, 2026

With HUMA still below several key resistance levels, the next move could help show whether the recent rebound develops into a broader recovery or whether selling pressure returns.
Huma Finance (HUMA) technical analysis
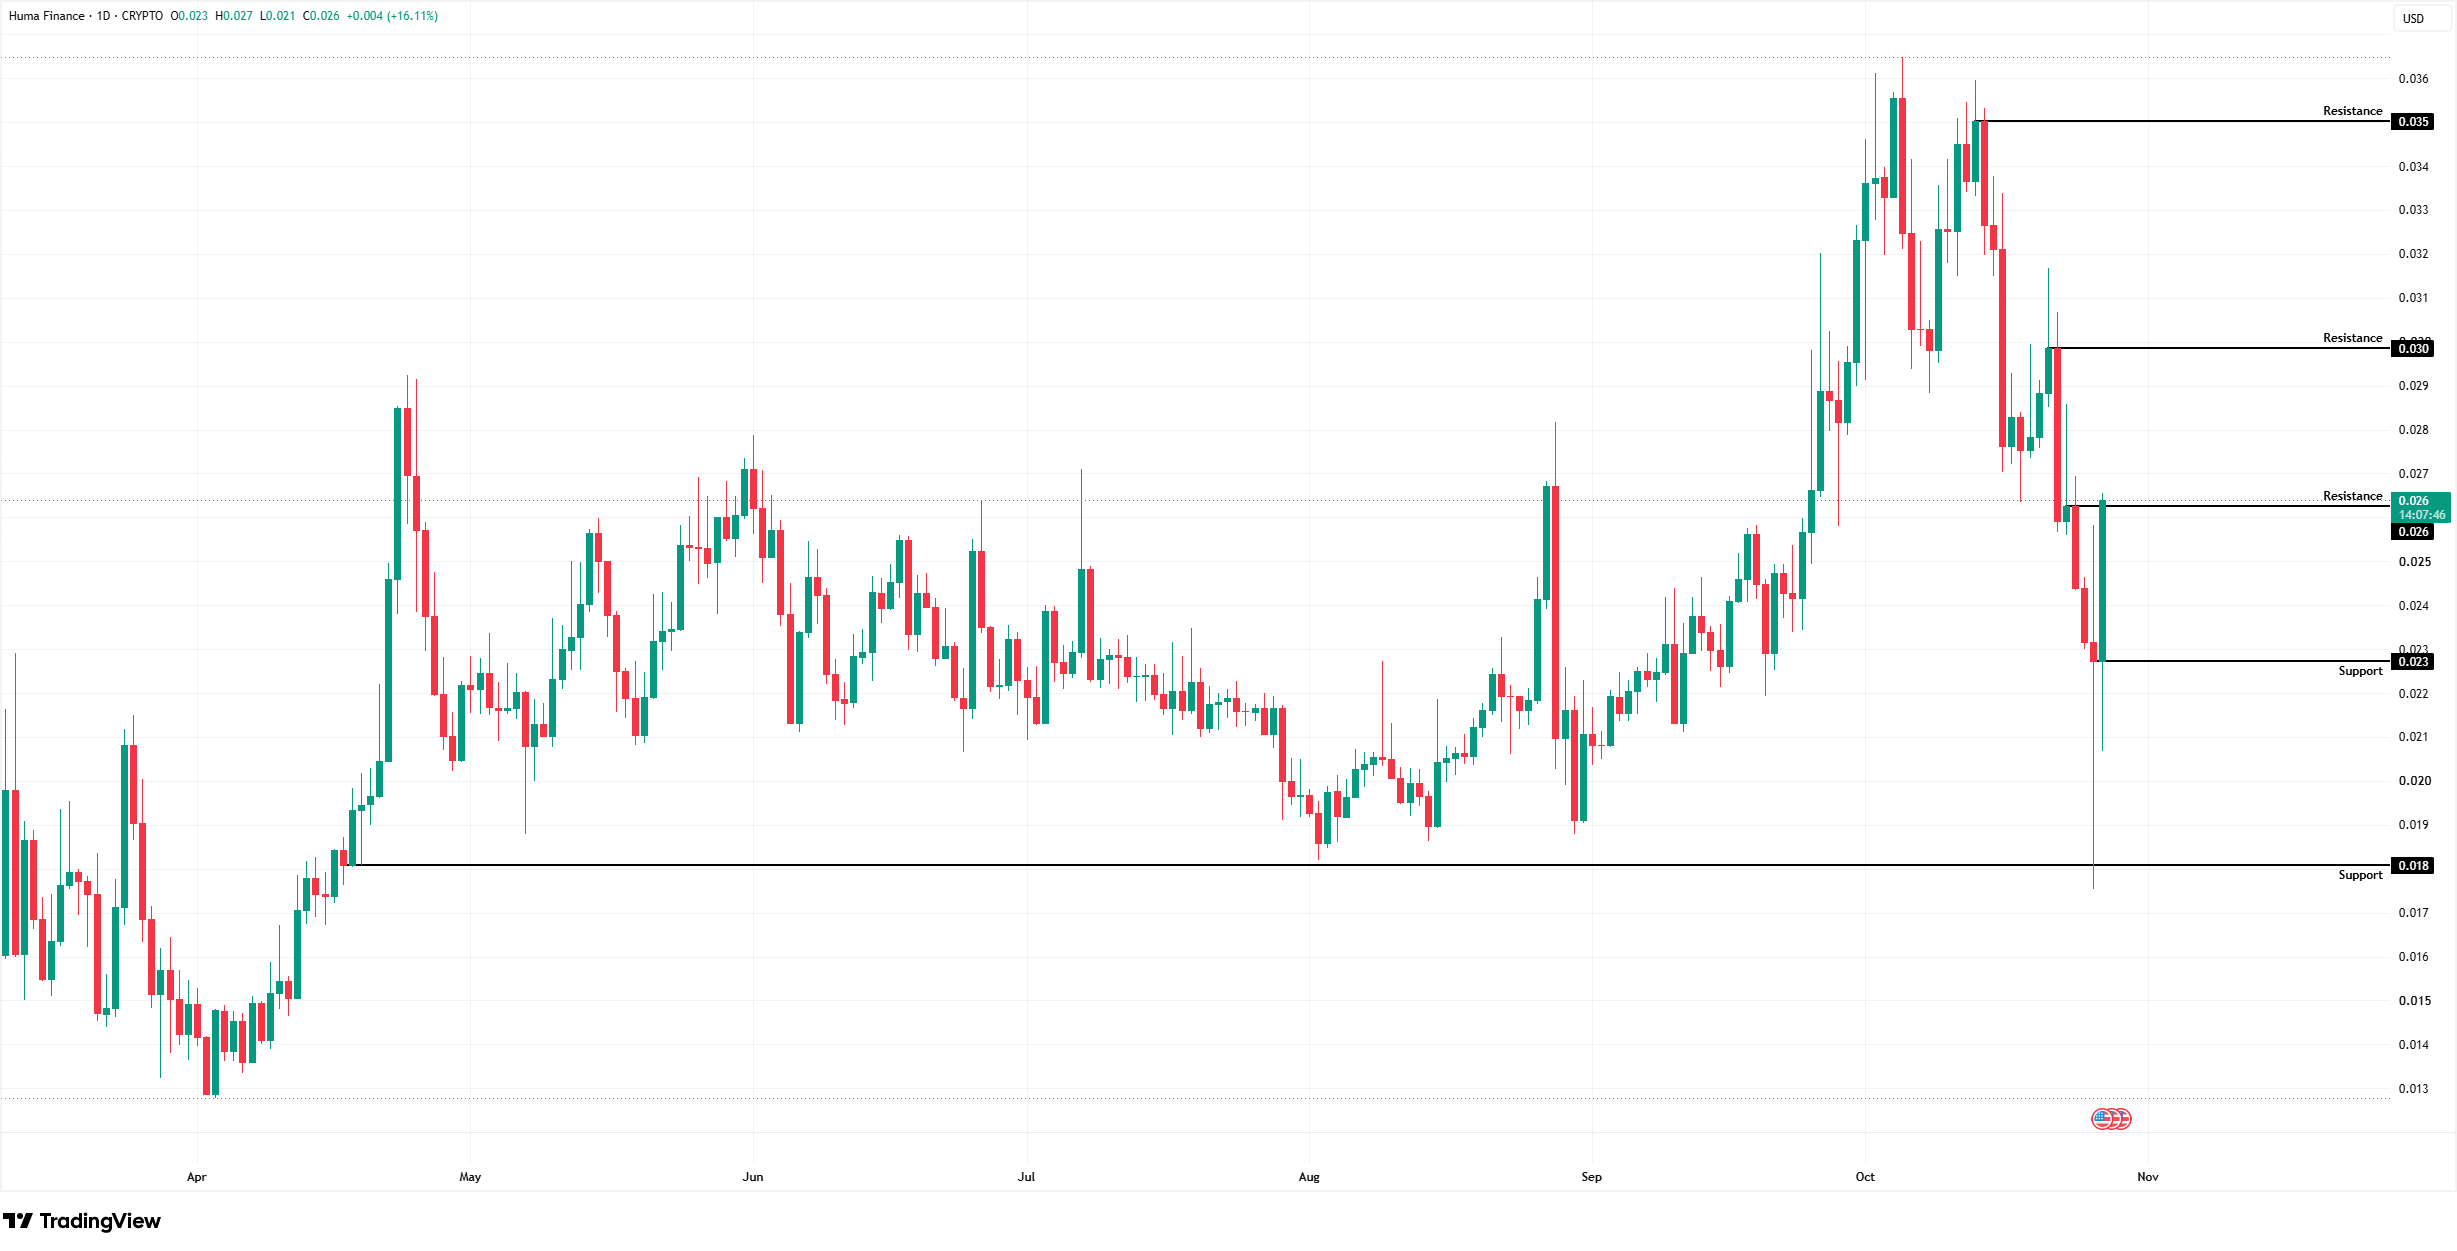
HUMAUSD - 1 Day time Frame
The daily chart shows HUMA climbing above $0.035 earlier in October before sellers regained control. The subsequent decline produced lower highs and lower lows, keeping the short-term structure under pressure. The rebound toward $0.026 does not yet confirm a reversal, particularly while the latest daily candle remains open.
The first support to watch is $0.023, which the price has moved back above during the latest rebound. If HUMA revisits this area, buyer activity could become important in determining whether the recovery remains intact. A daily close below $0.023 could weaken the rebound and increase the possibility of another move lower.
The second support is located at $0.018. A recent candle briefly moved below this level before recovering sharply, leaving a long lower wick that suggests buying interest emerged at lower prices. If HUMA returns to this area, a daily close above it followed by renewed gains could support another recovery attempt. A sustained daily close below $0.018, however, could increase the risk of further downside.
Huma Finance (HUMA) price target
The first upside target is the resistance at $0.026, which HUMA is already testing. A sustained daily close above this level could strengthen the recovery. If the price subsequently pulls back, holding the same area as support could provide stronger confirmation than a brief move above resistance.
A confirmed break above $0.026 could shift attention toward the second target at $0.030. This area marked a recent rebound high before another sharp sell-off, making it an important level to monitor. A daily close above $0.030, followed by a successful retest of the area as support, could strengthen the case for a move toward the next resistance.
The third target is located around $0.035, near the area where HUMA encountered selling pressure earlier in October. Increased selling pressure could emerge again as the price approaches the recent highs. A sustained breakout above $0.035, followed by an ability to hold the level during a potential pullback, could improve the broader bullish structure and create room for further gains.
From a wider perspective, sentiment across the crypto market could also influence HUMA’s recovery. Stronger market conditions may support further upside, while renewed selling pressure could place the key support levels under greater pressure.
Crypto assets are unregulated, decentralised and highly volatile assets which entail substantial risks and you may lose all invested capital. Refer to the Disclaimers for detailed information on potential risks.