Zcash (ZEC) Faces Correction After Strong Rally
BITmarkets Team
Oct 01, 2026

With the token now showing signs of slowing after its sharp September advance, the short-term focus is shifting toward whether the market enters a broader correction before attempting another move higher. Several downside levels could become important if selling pressure continues.
Zcash (ZEC) technical analysis
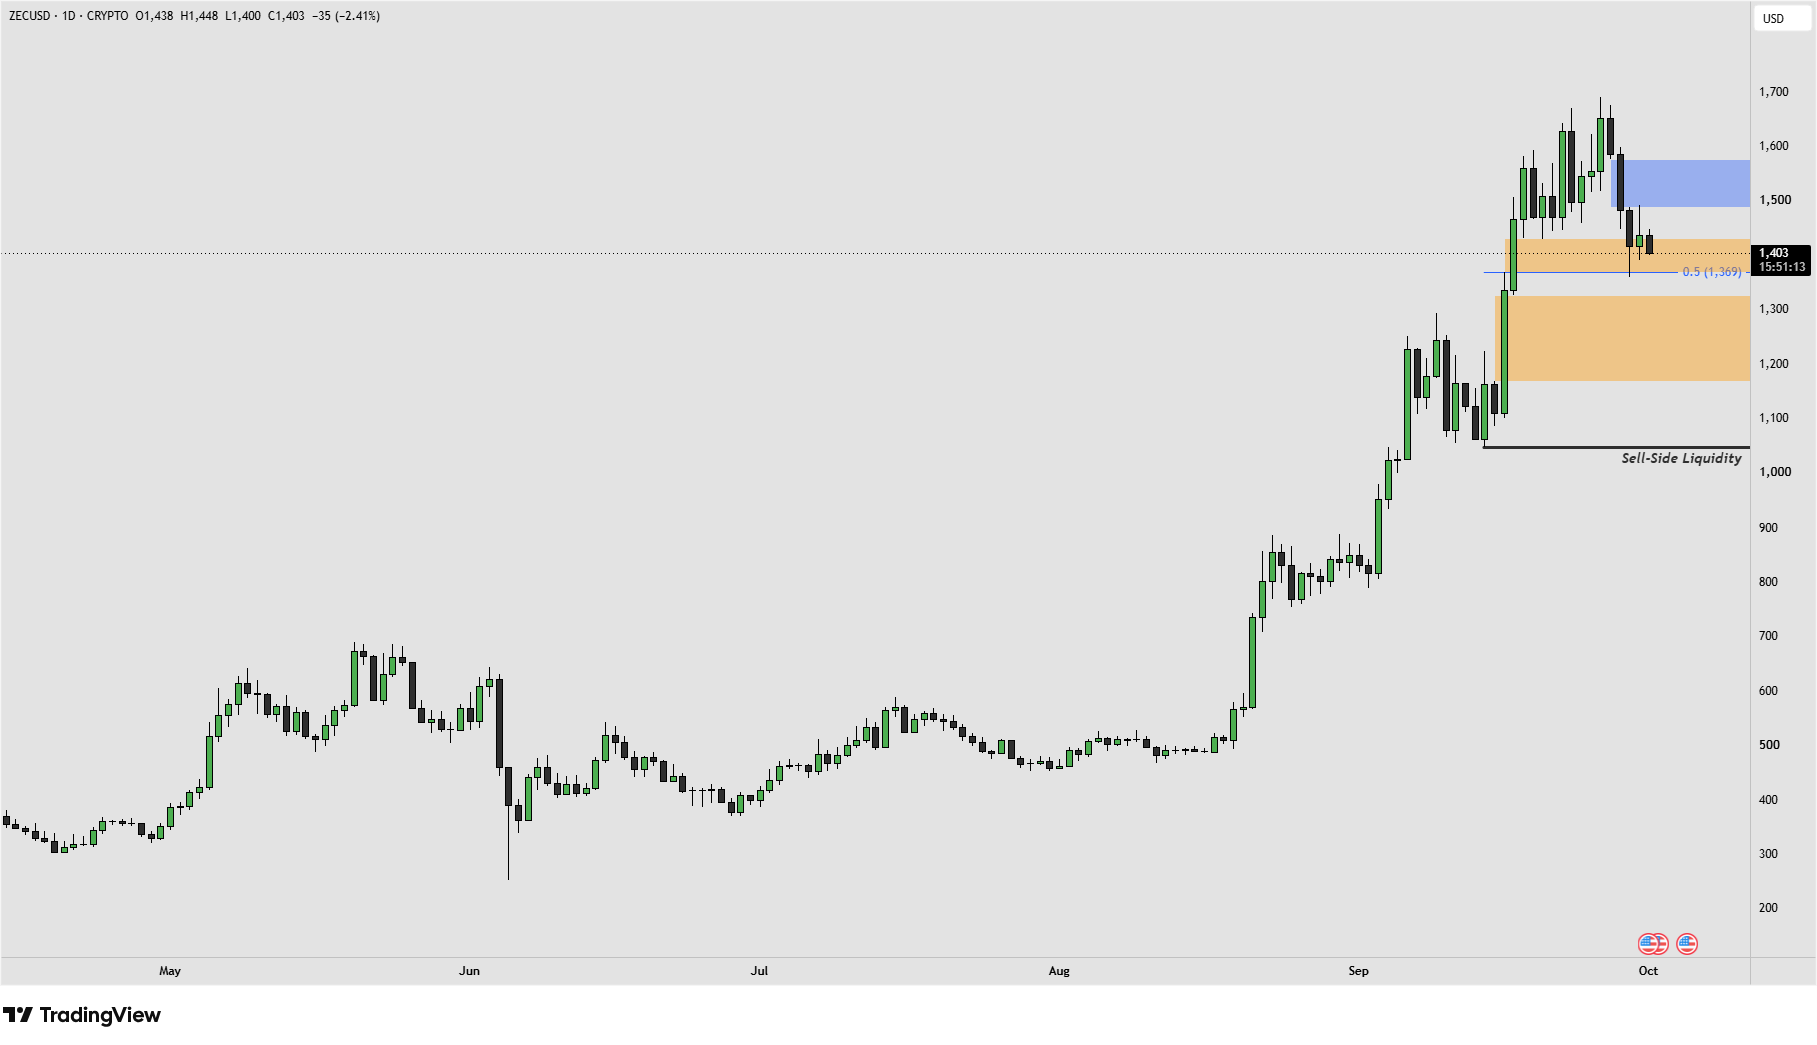
ZECUSD - 1 Day Time Frame
ZEC has formed a daily resistance area between approximately $1,490 and $1,575, where several reactions from higher prices have already appeared. This represents an important change in the short-term picture. The rally through September was highly impulsive, but the latest price action has shown weaker follow-through near the highs. As long as ZEC remains below the newly formed resistance zone, the probability of a corrective move could remain elevated.
The nearest technical level on the downside is the 0.5 Fibonacci retracement around $1,369. This level represents the midpoint of the latest bullish leg and could become the first area where selling pressure begins to slow or buyers attempt to stabilize the market. However, the presence of resistance above the current price means that $1,369 may not necessarily mark the end of the correction. If selling pressure remains active, ZEC could continue toward deeper support areas.
The first major support zone is located approximately between $1,170 and $1,320. This area formed during an earlier stage of the rally and could become the next significant downside reference if the correction extends. Below that, Sell-Side Liquidity is positioned around $1,040, representing another important area to monitor in the event of a deeper decline.
Zcash (ZEC) price target
The immediate downside reference is the $1,369 Fibonacci retracement. A reaction from this area could temporarily stabilize the price, while a sustained move below it could shift attention toward the broader $1,170–$1,320 support zone. If this support area also fails to hold, the next major downside target could be the Sell-Side Liquidity level near $1,040.
On the upside, the $1,490–$1,575 resistance zone remains the key area that could challenge the current corrective outlook. A sustained move back above this range could weaken the bearish short-term scenario and suggest that buyers are regaining momentum.
For now, ZEC is no longer showing the same impulsive strength that defined the earlier phase of its rally. The current structure leaves $1,369 as the first downside level to watch, followed by $1,170–$1,320 and potentially $1,040 if the correction deepens.
Crypto assets are unregulated, decentralised and highly volatile assets which entail substantial risks and you may lose all invested capital. Refer to the Disclaimers for detailed information on potential risks.