Is Solana (SOL) Going Bullish?
BITmarkets Team
Jul 13, 2026

Solana (SOL) technical analysis
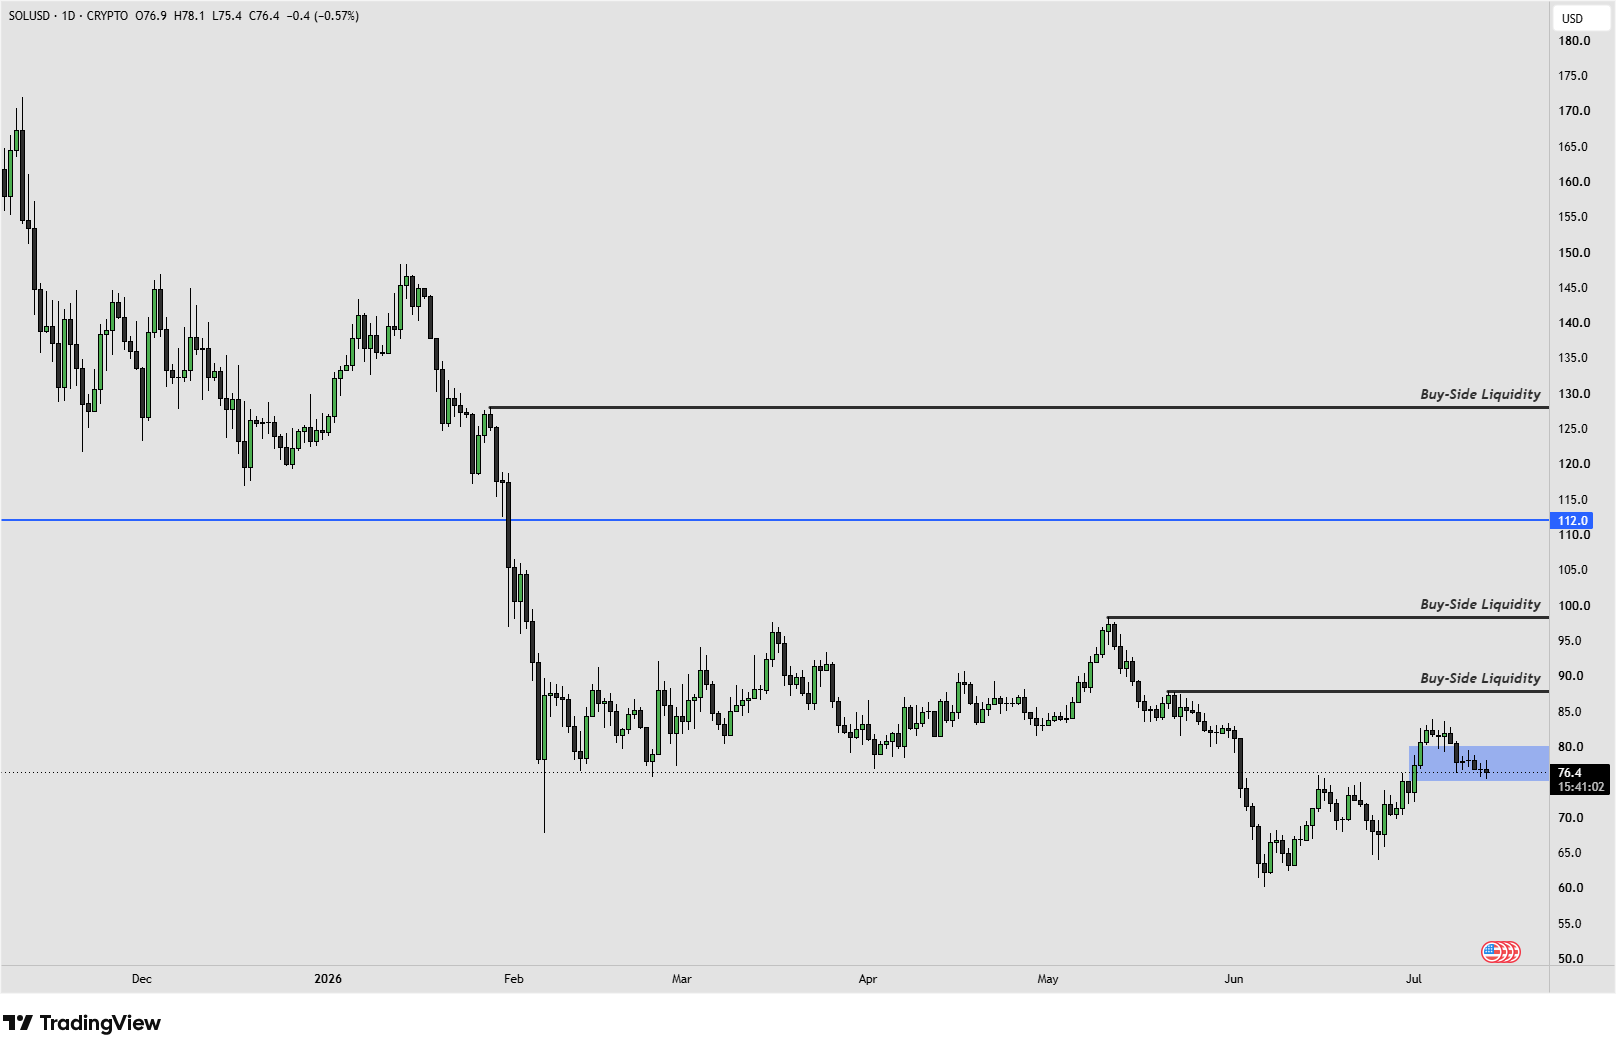
SOLUSD - 1 Day Time Frame
The newly established support zone, highlighted in blue on the chart, provides the foundation for the current bullish scenario. However, the higher-timeframe external structure remains bearish, meaning the recent move is still best viewed as an internal bullish correction rather than confirmation of a broader trend reversal.
As long as Solana continues to hold above the current support zone, a long position could be considered. From a risk-management perspective, a protective Stop Loss could be placed around $72, where the current bullish setup would lose its primary structural support.
Solana (SOL) price target
If bullish momentum continues, the nearest Buy-Side Liquidity zones are located around $88, $98, $112, and $128. These levels represent logical upside objectives, as price often gravitates toward liquidity resting above previous highs after establishing a strong support base.
The key level to monitor remains the lower boundary of the blue support zone, around $75. A daily close below this area could be an early warning that the current bullish correction is losing momentum, allowing traders to reduce exposure before the final Stop Loss level is reached.
Such a move could suggest that the broader bearish structure is beginning to regain control. For now, however, as long as SOL continues to trade above its newly formed support zone, the technical outlook remains constructive, with the focus on the Buy-Side Liquidity levels at $88, $98, $112, and $128.
Crypto assets are unregulated, decentralised and highly volatile assets which entail substantial risks and you may lose all invested capital. Refer to the Disclaimers for detailed information on potential risks.