Tron (TRX) Targets $0.375 — September 2026 Outlook
BITmarkets Team
Aug 19, 2026

Tron (TRX) technical analysis
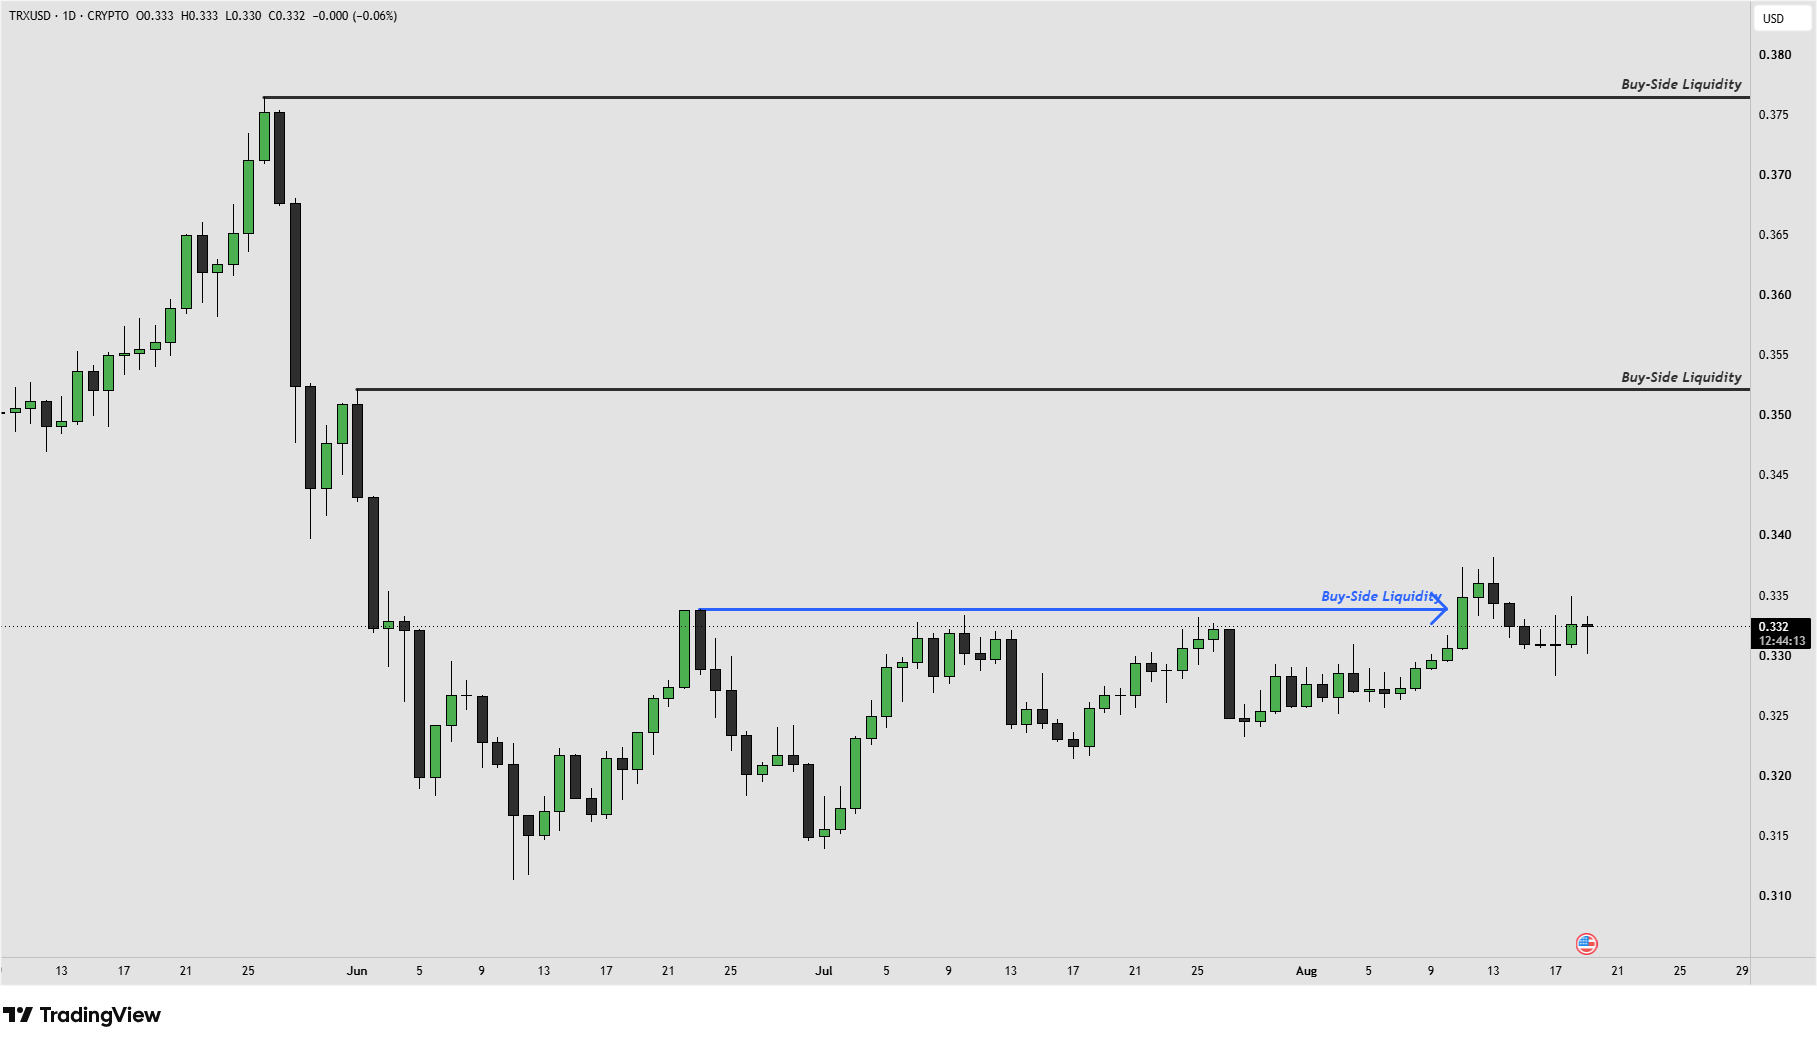
TRXUSD - 1 Day Time Frame
Since mid-June, TRX had repeatedly attempted to break above $0.334, but buyers were unable to secure a close above the level even after a third attempt. This changed on August 11, when the price gained more than 2% in a single day and finally closed above $0.334. From a liquidity perspective, this level can also be viewed as a reference point for Buy-Side Liquidity.
From a trading perspective, the reaction after price moves through such a liquidity level is particularly important. If a sweep of Buy-Side Liquidity is followed by an impulsive bearish move, it could create conditions for a potential short setup. In the current TRX case, however, this has not occurred.
After breaking above $0.334, the price has declined only in a corrective manner. This slower pullback suggests that buyers remain present and that the breakout has not been aggressively rejected. In other words, the current correction could still support a continuation of bullish price delivery.
Based on this structure, a long position could be considered while the breakout remains intact. The fact that TRX has remained around the reclaimed area rather than immediately reversing lower strengthens the long-side scenario. As long as the correction remains controlled, the market could continue seeking liquidity at higher levels.
From a risk-management perspective, a protective Stop Loss could be placed below the origin of the latest bullish price delivery, around $0.326. A move below this level may weaken the current bullish setup and suggest that the breakout above $0.334 is losing strength.
Tron (TRX) price target
If bullish price delivery continues, the next Buy-Side Liquidity targets are located around $0.352 and $0.377. These levels represent potential upside objectives if buyers maintain control following the breakout. The first level at $0.352 could provide an initial test of buying strength. If TRX manages to move through this area, attention could shift toward the higher Buy-Side Liquidity level around $0.377.
For now, TRX maintains a constructive technical picture. The breakout above the repeatedly tested $0.334 level, followed by a controlled correction rather than an impulsive reversal, supports the possibility of further upside. As long as the breakout structure remains intact, attention could remain on the Buy-Side Liquidity zones at $0.352 and $0.377.
Crypto assets are unregulated, decentralised and highly volatile assets which entail substantial risks and you may lose all invested capital. Refer to the Disclaimers for detailed information on potential risks.