The Graph (GRT) Technical Analysis: Price Outlook 2026
BITmarkets Team
May 30, 2026

Despite the recent pullback, GRT continues to trade above several important support levels, leaving traders watching closely to determine whether the token can maintain its recovery trend or if broader market weakness could trigger another leg lower.
The Graph (GRT) technical analysis
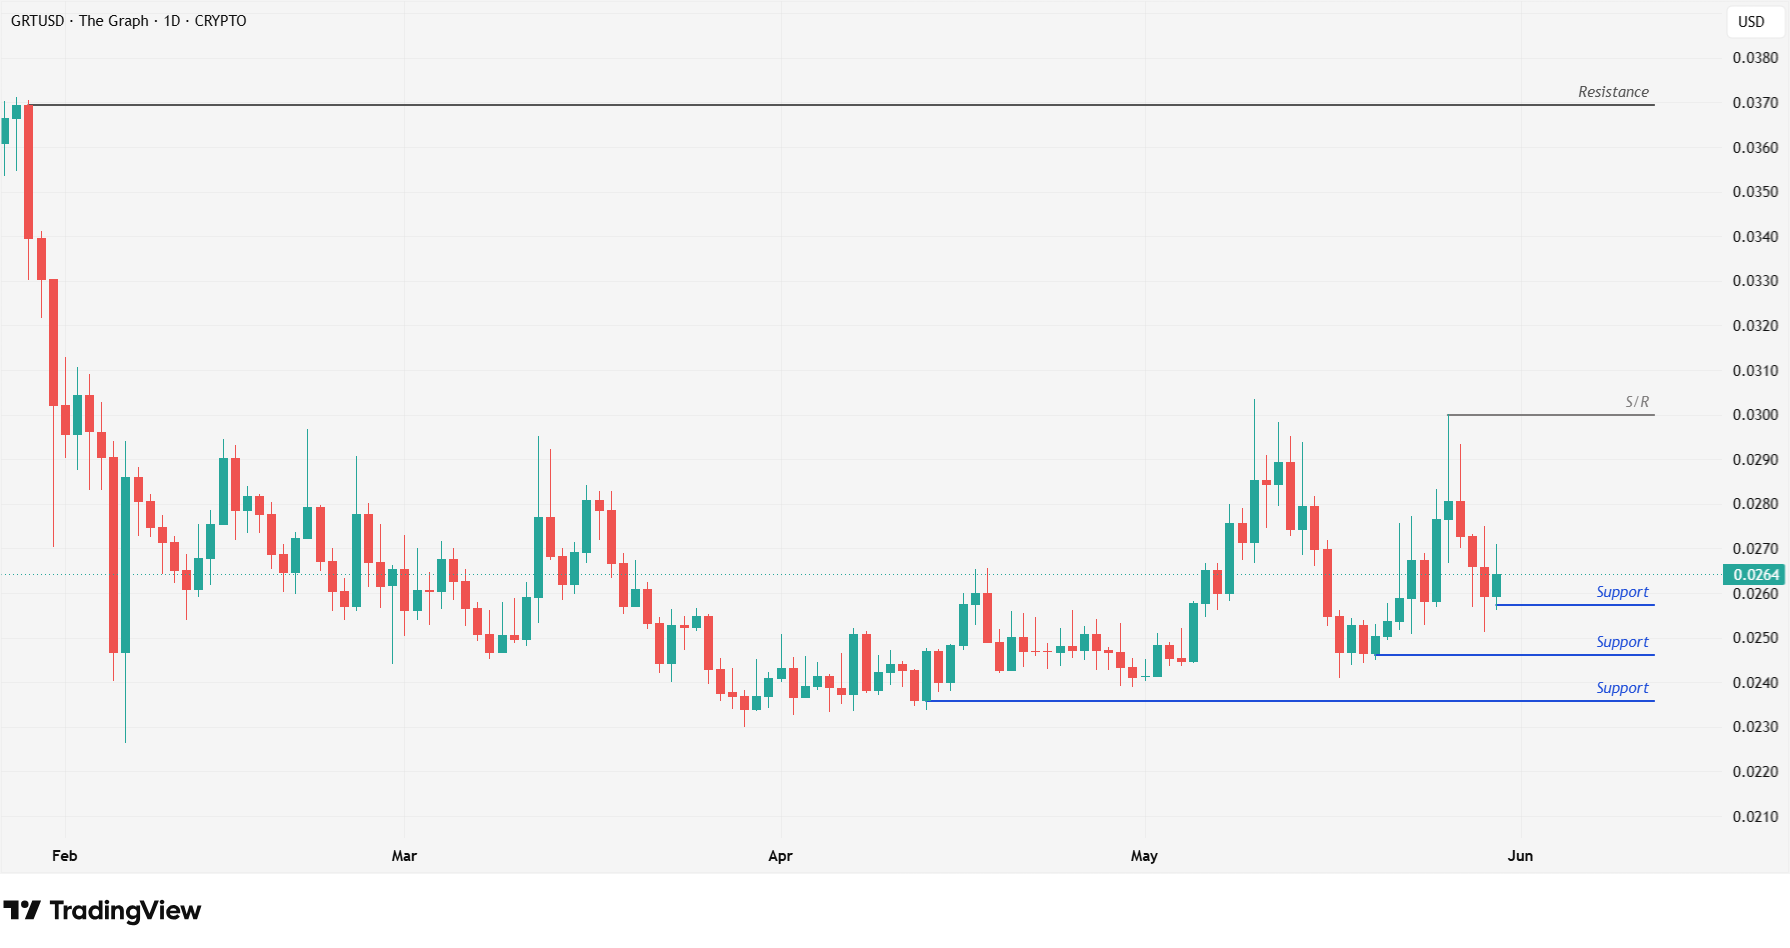
GRTUSD - 1 Day Time Frame
GRT is currently trading around $0.0264, holding slightly above the newly established $0.0260 support zone. This level has emerged as an important short-term floor and may continue to attract buying interest if market conditions stabilize.
On the upside, the nearest obstacle remains the psychologically significant $0.0300 S/R level, which is currently acting as resistance. The market has struggled to establish sustained acceptance above this area during recent rallies, making it a key level to monitor in the coming sessions.
If buyers manage to reclaim $0.0300 and turn it into support, attention could shift toward the next major resistance near $0.0370, a level last seen in late January 2026. Such a move would suggest improving momentum and a potential continuation of the broader recovery that began earlier this quarter.
However, if selling pressure persists, GRT may continue consolidating between support and resistance or revisit lower support levels. The first area to monitor would be $0.0250, which acted as support during May. A deeper correction could bring $0.0235 into focus, a level that previously provided support in mid-April 2026.
The Graph (GRT) price target
For the bullish outlook to strengthen, GRT would likely need to break above the $0.0300 resistance zone and establish it as support. If successful, the next upside target could emerge near $0.0370, where a significant resistance area remains visible on the daily chart.
On the downside, maintaining the $0.0260 support level remains important for preserving the current recovery structure. A move below this area could increase the likelihood of a retest of $0.0250, while further weakness may expose the lower support zone around $0.0235.
For now, GRT remains caught between nearby support and resistance, with broader cryptocurrency market sentiment, macroeconomic developments, and geopolitical events likely to play an important role in determining its next directional move.
Crypto assets are unregulated, decentralised and highly volatile assets which entail substantial risks and you may lose all invested capital. Refer to the Disclaimers for detailed information on potential risks.