Will Arbitrum (ARB) Go Up in 2026?
BITmarkets Team
Jul 22, 2026

Arbitrum (ARB) technical analysis
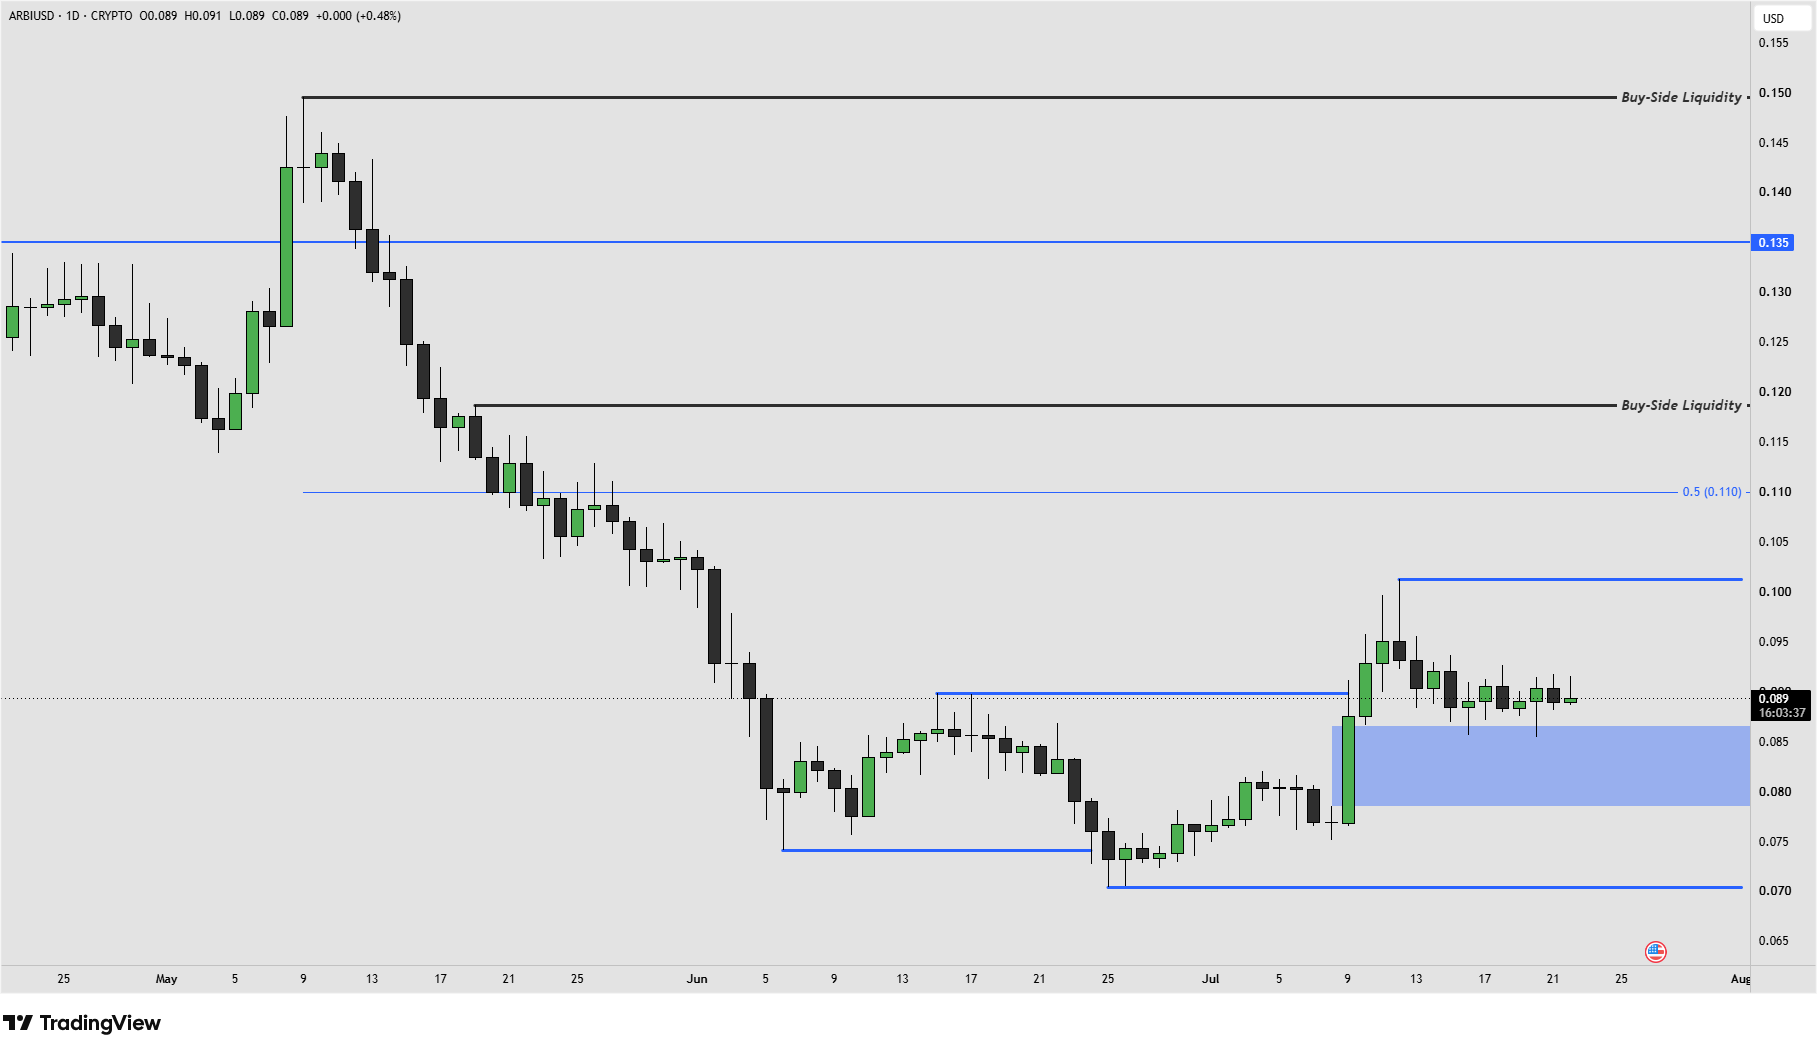
ARBUSD - 1 Day Time Frame
On July 10, ARB closed above its previous internal lower high, signaling a shift from an internal bearish structure to internal bullish price delivery. This is an important technical development, as it suggests that buyers have regained short-term control after an extended period of weakness.
At the same time, the price established a relatively broad support zone between 0.079 USD and 0.087 USD, highlighted in blue on the chart. As long as ARB continues to hold above this area, the current bullish structure could remain intact.
Despite this improvement, the broader picture still deserves attention. ARB continues to trade within an external bearish structure, meaning the recent advance is currently best viewed as an internal bullish correction rather than confirmation of a longer-term trend reversal.
One of the most important technical levels is the 0.5 Fibonacci retracement of the latest external bearish move. This area often acts as a key reaction point, as internal bullish corrections within broader bearish trends can lose momentum around the midpoint of the previous decline.
If ARB reaches this level and encounters strong selling pressure, the broader bearish trend could begin to reassert itself. Conversely, if the market absorbs that selling pressure and continues higher, the bullish scenario could remain valid.
Arbitrum (ARB) price target
If bullish momentum continues, the first major upside targets are the Buy-Side Liquidity zones around 0.120 USD and 0.150 USD. Between these levels, the psychological 0.135 USD area could also serve as an intermediate reaction point where some profit-taking may emerge.
From a risk-management perspective, a protective Stop Loss could be considered around 0.075 USD. A move below this level could weaken the current bullish structure and reduce the probability of further upside.
Overall, ARB has improved its short-term technical outlook after breaking above its previous internal lower high and establishing a new support zone between 0.079 USD and 0.087 USD. As long as this support holds, the focus could remain on the upside targets at 0.120 USD and 0.150 USD, while the reaction around the 0.5 Fibonacci retracement will likely play a key role in determining whether the current recovery extends further or stalls within the broader bearish trend.
Crypto assets are unregulated, decentralised and highly volatile assets which entail substantial risks and you may lose all invested capital. Refer to the Disclaimers for detailed information on potential risks.