RENDER Jumps 15% — Is $2 Next?
BITmarkets Team
Sep 18, 2026

With RENDER now trading around $1.76, the token is approaching an important resistance area after climbing rapidly from its recent low near $1.31. The latest move has improved the short-term technical picture, although buyers still face several significant levels before a broader move higher could develop.
Render technical analysis
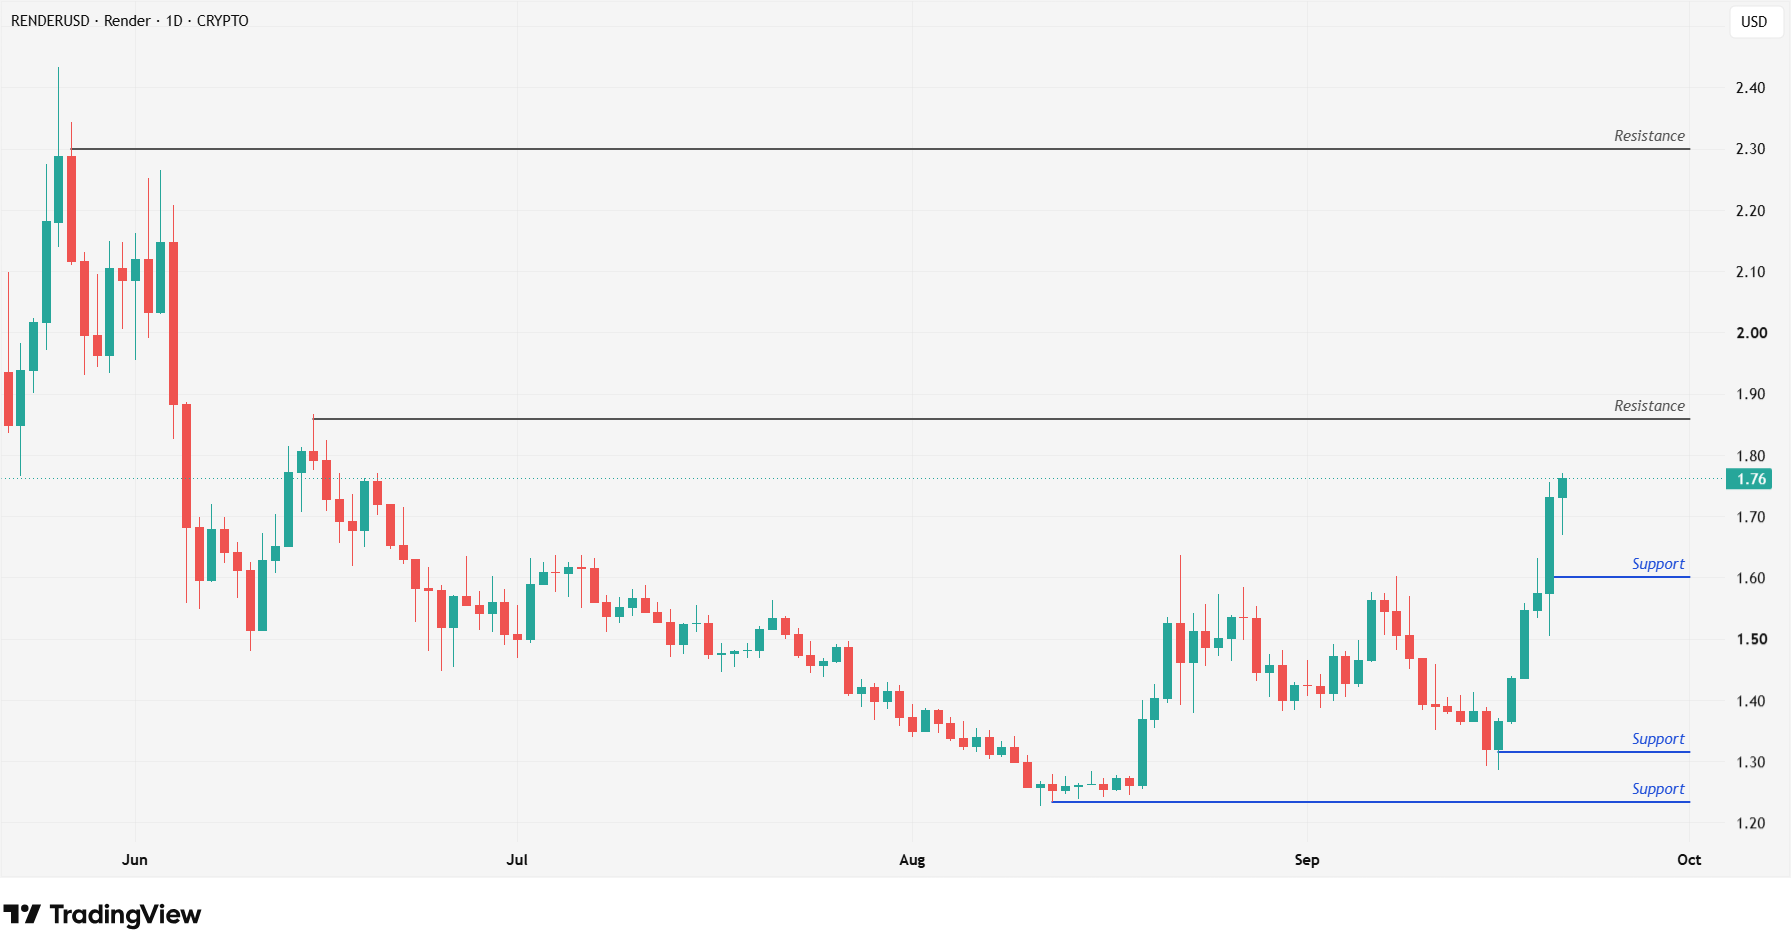
RENDERUSD - 1 Day Time Frame
RENDER is currently trading around $1.76, following a strong rebound from the support area near $1.31. The latest rally has pushed the token above $1.60, which now represents the nearest important support level.
Holding above $1.60 could help preserve the improving short-term structure and provide a foundation for another attempt higher. The recent strength is particularly notable given that RENDER was trading close to $1.30 only several days earlier. The immediate obstacle for buyers is the resistance area around $1.86–$1.87. This level previously acted as an important price area in June, making it a significant test for the current recovery.
A sustained breakout above this resistance could strengthen the bullish picture and potentially allow the former resistance to begin acting as support. Conversely, rejection could result in consolidation or a pullback toward $1.60. If $1.60 fails to hold, the next important support is located around $1.31, followed by a deeper structural support near $1.23.
Render price target
The immediate upside target is the resistance area around $1.86–$1.87. A sustained move through this level could provide another positive technical signal and open the way toward significantly higher prices.
The next major resistance would then be located around $2.30, which represents a prominent previous high visible on the daily chart. Given the distance between the two resistance areas, periods of consolidation or additional selling pressure could emerge before RENDER attempts to reach this higher target.
On the downside, failure to overcome $1.86–$1.87 could leave the token consolidating above $1.60. A break below this support would weaken the latest recovery and could shift attention toward $1.31, while further weakness could bring the $1.23 area back into focus.
For now, RENDER's nearly 37% year-to-date gain and latest rebound point to an improving technical picture. The $1.86–$1.87 range represents the key near-term level to watch: a sustained breakout could shift attention toward $2.30, while rejection could increase the likelihood of consolidation or a pullback toward lower support levels.
Crypto assets are unregulated, decentralised and highly volatile assets which entail substantial risks and you may lose all invested capital. Refer to the Disclaimers for detailed information on potential risks.