How High Can Ethereum Go in 2026?
BITmarkets Team
Jul 15, 2026

Ethereum (ETH) technical analysis
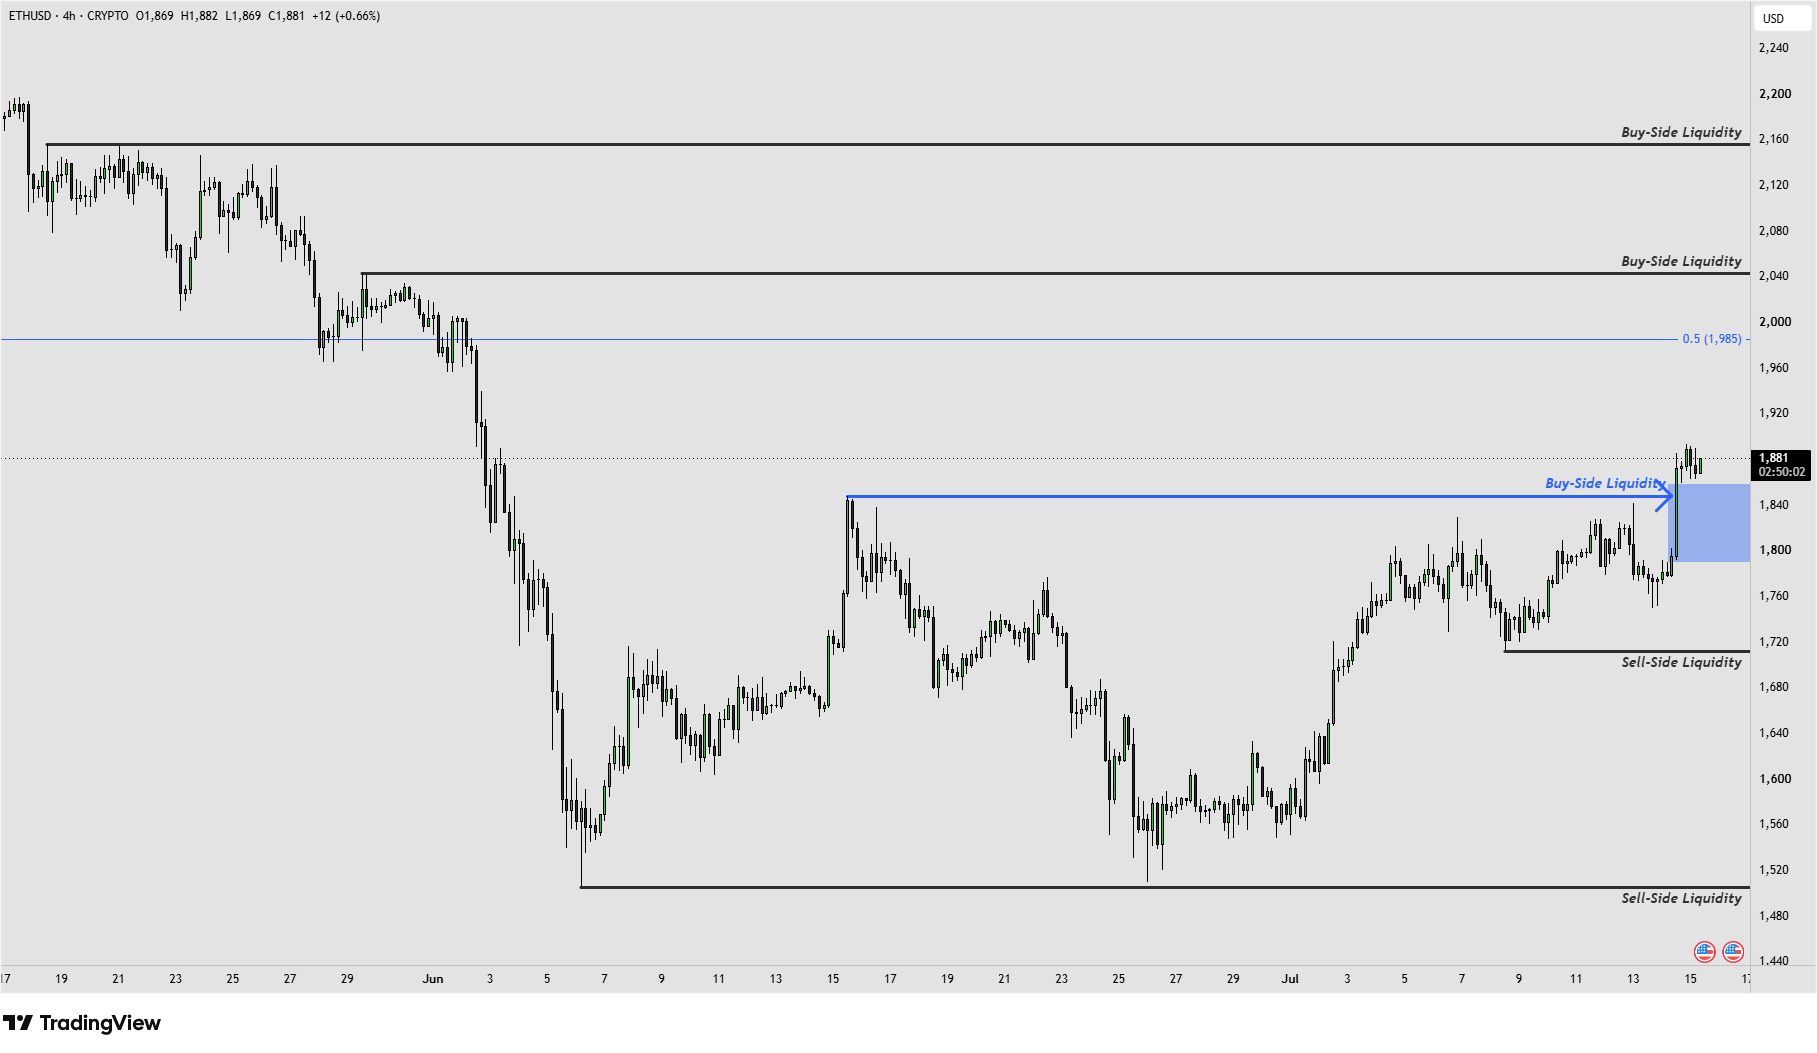
ETHUSD - 4 Hour Time Frame
Ethereum recorded an impulsive move of nearly 7%, creating a key support zone on the 4-hour timeframe. For better visualization, this zone is highlighted in blue on the attached chart and is located between $1,800 and $1,860. This area now represents the main structural base for the current bullish scenario.
Based on this development, a long position may be considered, provided price continues to hold 4-hour candle bodies above the lower boundary of the support zone. As long as Ethereum respects this area, the short-term structure remains constructive and bullish momentum could continue to build.
If a 4-hour candle body closes below the lower boundary of the support zone, however, the bullish outlook may weaken. In that case, it may be appropriate to reduce part of the position before the final Stop Loss level is reached. The main protective Stop Loss could be placed around $1,750, where the current setup would lose its primary structural support.
Ethereum (ETH) price target
If bullish momentum remains intact, the first upside target is the 0.5 Fibonacci retracement level at $1,985. This area is particularly important because Ethereum is still trading within a broader external bearish structure, making it a potential turning point for price action.
A sustained move above the 0.5 Fibonacci level could support further upside toward the nearest Buy-Side Liquidity zones at $2,045 and $2,160. These levels represent logical upside objectives, as price often gravitates toward liquidity resting above previous highs after establishing a strong support base.
On the other hand, if Ethereum encounters strong selling pressure around the 0.5 Fibonacci level, bearish momentum could begin to re-emerge. For now, the bullish scenario remains valid as long as price holds above the $1,800–$1,860 support zone, while a close below this area may warrant more active position management.
Crypto assets are unregulated, decentralised and highly volatile assets which entail substantial risks and you may lose all invested capital. Refer to the Disclaimers for detailed information on potential risks.