Ethereum (ETH) Eyes Recovery After 15% Weekly Pullback
BITmarkets Team
Nov 11, 2026

Ethereum is currently trading around $1,811 after falling sharply from above $2,400 earlier in November. With the price now attempting to stabilize near an important support area, the next reaction could help determine whether buyers can slow the decline and begin rebuilding momentum or whether the correction extends further.
Ethereum (ETH) technical analysis
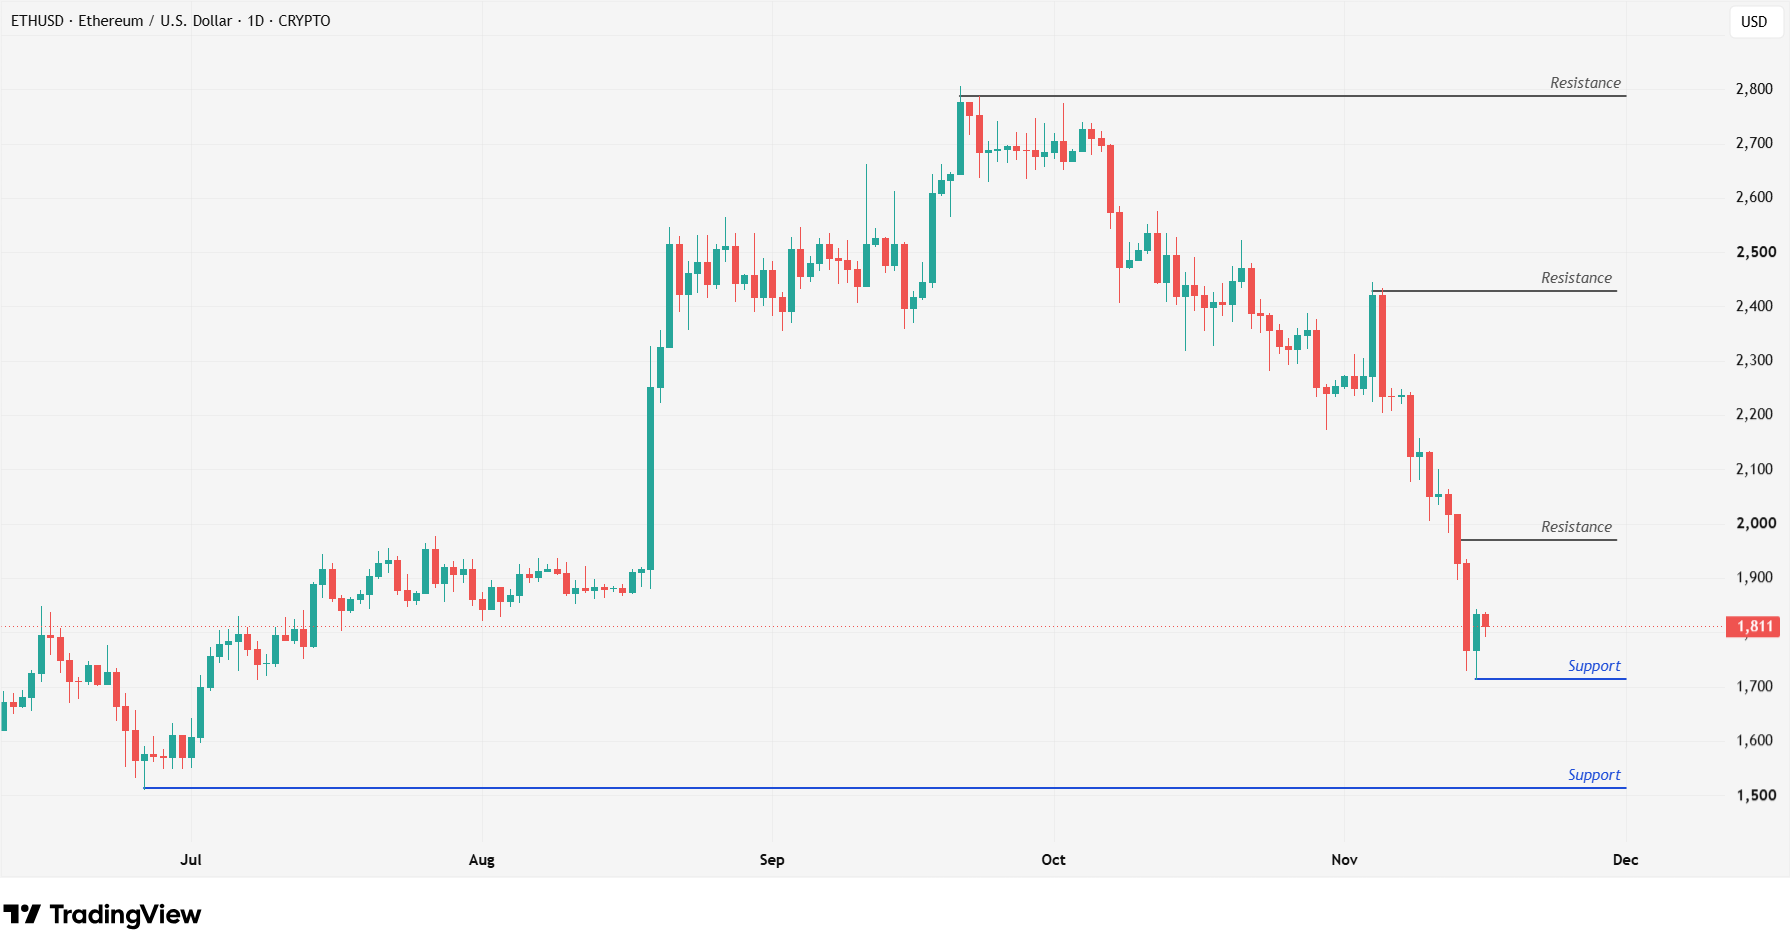
ETHUSD - 1 Day Time Frame
Ethereum is currently trading around $1,811, following a sustained decline from the $2,400 area. The nearest important support is located around $1,710–$1,720. This area has already attracted buyer interest during the latest sell-off and represents the first major level to monitor if selling pressure continues.
A constructive reaction from this zone could help ETH stabilize and potentially provide the basis for a short-term recovery. A sustained daily move below it, however, could weaken the structure further and shift attention toward the stronger support near $1,510.
The $1,510 area corresponds with the June low and represents a significantly stronger structural support level. A move toward this area would indicate a much deeper correction from the September highs.
For now, the short-term structure remains under pressure, although ETH's proximity to support means the reaction around current levels could be particularly important.
Ethereum (ETH) price target
The first important upside resistance is located around $1,980–$2,000. This area represents the nearest major barrier buyers would need to overcome for the short-term technical outlook to begin improving. A sustained recovery above $2,000 could shift attention toward the next major resistance around $2,430–$2,450.
If bullish momentum strengthens further, the larger resistance near $2,780–$2,800 could eventually return into focus. This area corresponds with the September and October highs and would likely represent a considerably stronger technical obstacle.
On the downside, $1,710–$1,720 remains the key support zone to watch. A sustained break below it could increase the risk of a deeper decline toward $1,510.
For now, Ethereum is testing an important technical area following its sharp weekly decline. A successful defense of the $1,710–$1,720 support zone could provide the foundation for a recovery toward $1,980–$2,000, followed by $2,430–$2,450 if buyer momentum improves.
Crypto assets are unregulated, decentralised and highly volatile assets which entail substantial risks and you may lose all invested capital. Refer to the Disclaimers for detailed information on potential risks.