Compound (COMP) Jumps 10% — What's Next?
BITmarkets Team
Aug 18, 2026

Compound (COMP) technical analysis
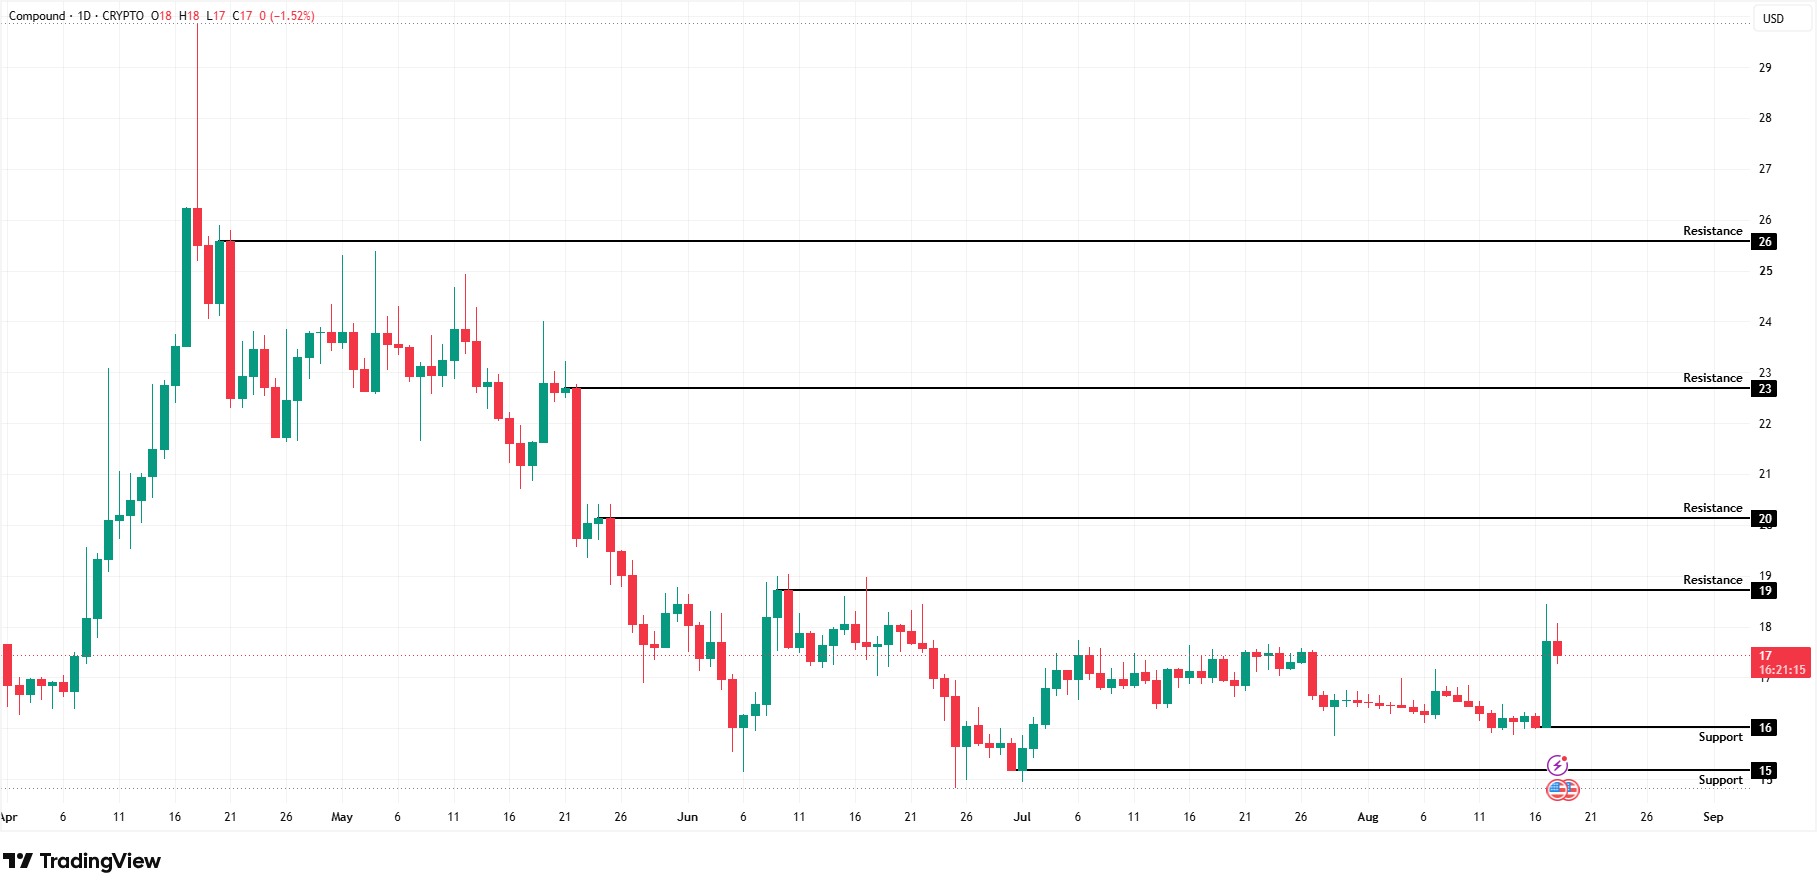
COMPUSD - 1 Day Time Frame
After forming a local low at $15, COMP consolidated sideways for several weeks. A bullish market structure subsequently began to form, characterized by a series of higher highs and higher lows. Since that local bottom, the price has risen by more than 18%, indicating an improvement in buying activity. COMP is currently trading at approximately $17. Looking ahead, it will be important to monitor whether the price can maintain its current bullish structure while remaining above the nearest support areas.
The first and most significant support is located around $16. If the price declines toward this area, increased buying activity and a stronger market reaction could emerge. However, a higher-timeframe candle close below this level could signal a shift toward a bearish market structure and open additional room for a potential continuation lower.
If the $16 support fails to hold, attention could shift to the second significant support around $15. Here, it would again be important to monitor whether buyers are able to defend the level. A successful hold followed by a move higher could indicate price stabilization and a potential recovery in favor of buyers.
Compound (COMP) price target
If COMP attracts sufficient buying pressure in the coming days, the first upside target could be the strong resistance around $19. Increased selling activity may emerge if this level is retested, as it represents the nearest significant obstacle to further growth. If buyers manage to break through this resistance, a candle close above $19 could strengthen the case for further upside. During a subsequent pullback, holding above this area would provide additional confirmation of the breakout. In this scenario, the second price target would be $20.
The $20 level also represents an important psychological threshold where stronger selling pressure and profit-taking could emerge. If buyers manage to overcome this area, attention could then shift toward the third resistance target at $23. The final monitored target is located around $26, another significant resistance area. If COMP eventually breaks above this level, a candle close above it followed by the price holding the area during a potential pullback could support the case for further bullish continuation.
From a broader perspective, COMP is showing early signs of recovery, although the bullish structure may require further confirmation. Continued strength above the key resistance levels could improve the outlook, while a loss of the main support areas could shift momentum back in favor of sellers.
Crypto assets are unregulated, decentralised and highly volatile assets which entail substantial risks and you may lose all invested capital. Refer to the Disclaimers for detailed information on potential risks.