Chainlink (LINK) Eyes $13.50 Resistance — What’s Next?
BITmarkets Team
Oct 14, 2026

With LINK now trading around $12.10, the price has pulled back considerably from its recent peak and is approaching an important support area. The broader recovery from the summer lows remains visible on the daily chart, but the next move could depend on whether buyers can defend support and rebuild momentum toward the resistance levels above.
Chainlink (LINK) technical analysis
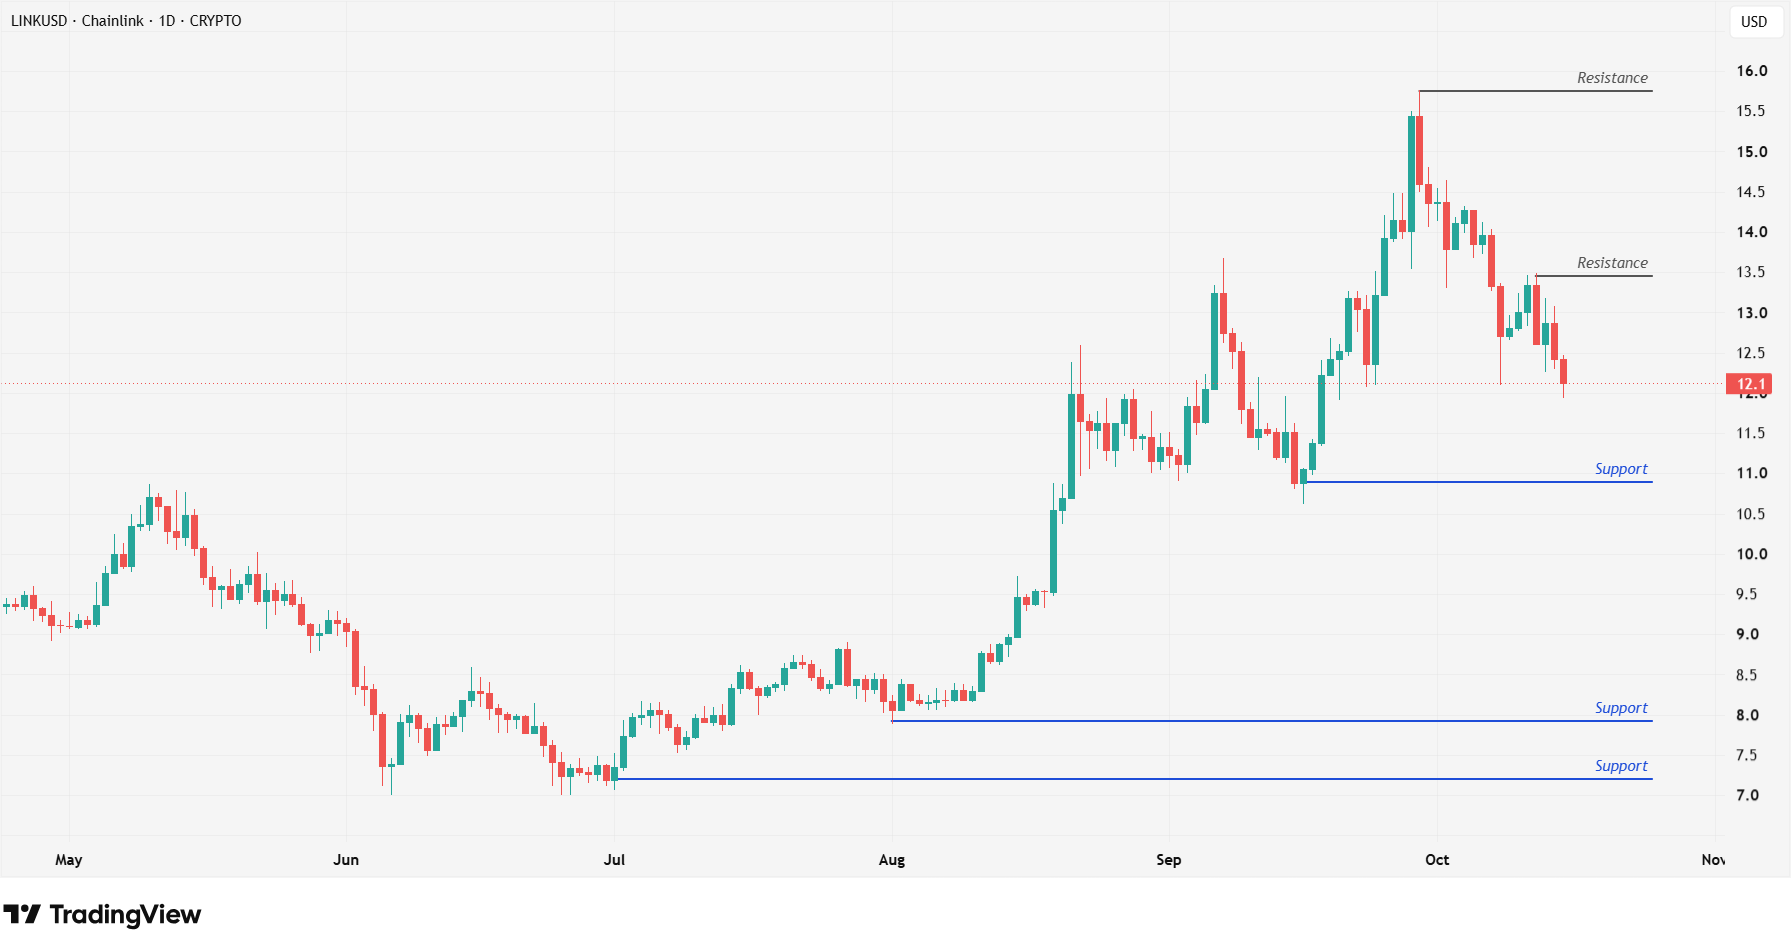
LINKUSD - 1 Day Time Frame
LINK is currently trading around $12.10, following a sustained correction from the late-September high near $15.50. The nearest major support is located around $10.90–$11.00. This area previously attracted buyers during September and represents the first important level to monitor if the current decline continues. Holding above this support could help stabilize the market and preserve the broader recovery structure. Conversely, a sustained move below $10.90 could weaken the technical picture and increase the possibility of a deeper correction.
Below this area, the next significant support is located around $8.00, which formed an important base during the summer. Further weakness could eventually bring the deeper support near $7.10 back into focus. On the upside, LINK now faces resistance around $13.50, where the latest recovery attempt stalled. Reclaiming this area would be an important first step toward rebuilding bullish momentum.
Chainlink (LINK) price target
The immediate upside target is the resistance area around $13.50. A sustained breakout above this level could improve the short-term technical picture and shift attention back toward the recent highs. The next major resistance is located around $15.70–$15.80, close to the late-September peak. This area could attract considerably stronger selling pressure if LINK manages to recover toward it.
On the downside, failure to stabilize above current levels could place the $10.90–$11.00 support zone back under pressure. A sustained break below this area could increase the likelihood of a correction toward $8.00, while further weakness could expose the deeper support around $7.10.
For now, $10.90–$11.00 represents the key downside area to watch, while $13.50 remains the first major upside obstacle. A recovery above resistance could bring $15.70–$15.80 back into focus, while losing support could deepen the current correction.
Crypto assets are unregulated, decentralised and highly volatile assets which entail substantial risks and you may lose all invested capital. Refer to the Disclaimers for detailed information on potential risks.