Arbitrum (ARB) Up 100% in One Month — What's Next?
BITmarkets Team
Sep 15, 2026

With ARB now trading around $0.153, the token has pulled back from its recent spike above $0.20 but remains well above its August lows. The latest recovery has significantly improved the short-term picture, although the size of the recent rally also leaves ARB vulnerable to periods of consolidation or deeper corrections before another attempt higher.
Arbitrum (ARB) technical analysis
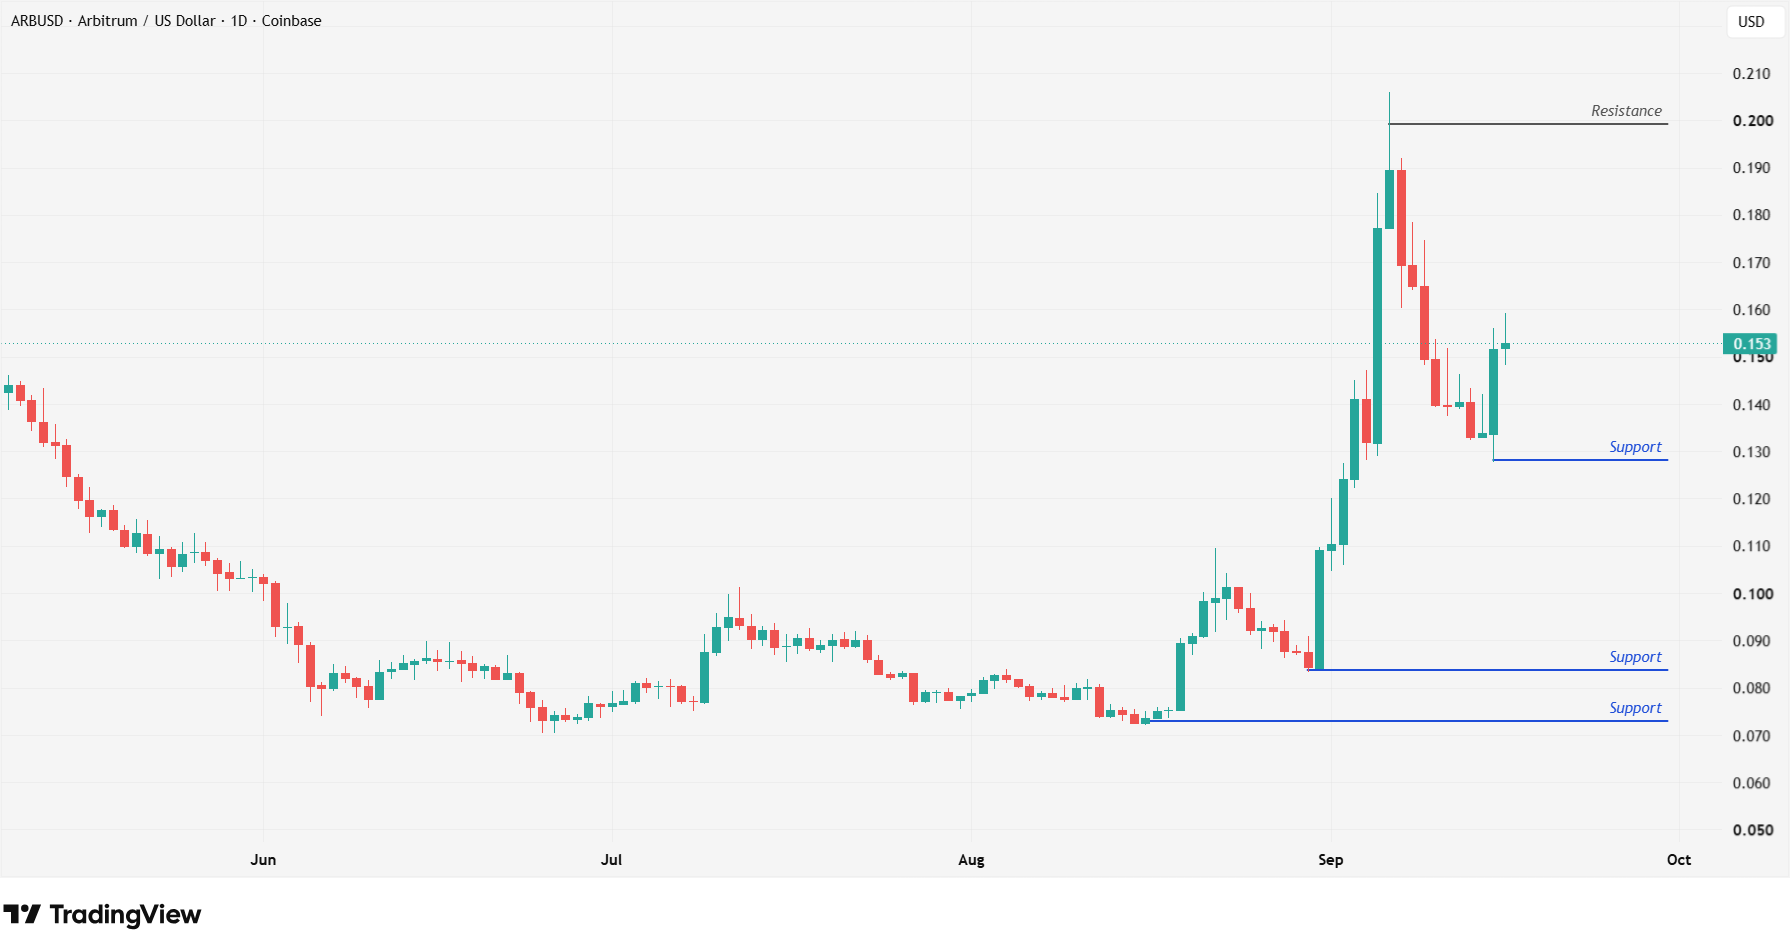
ARBUSD - 1 Day Time Frame
ARB is currently trading around $0.153, following a highly impulsive rally that briefly pushed the token above $0.20 in early September. After reaching this area, selling pressure emerged and ARB corrected toward approximately $0.13 before beginning to recover again.
The nearest important support is located around $0.129–$0.130. This area recently attracted buyer interest and could play an important role in determining whether the current recovery remains intact. Holding above $0.13 could provide a foundation for another attempt higher, while a sustained break below this area would weaken the short-term structure and increase the possibility of a deeper correction.
Below $0.13, the next major support is located around $0.084, which corresponds with the area ARB traded around before its September breakout. A deeper decline could eventually bring the stronger structural support near $0.072 back into focus.
Arbitrum (ARB) price target
The main upside target is the resistance area around $0.20, which also represents a psychologically significant price level. ARB briefly moved above this area during its latest rally but was unable to sustain the breakout.
A renewed move toward $0.20 would therefore represent an important test for buyers. A sustained breakout and ability to remain above this area could strengthen the bullish structure and potentially open the way toward higher levels not shown within the current chart range. Conversely, another rejection around $0.20 could lead to further consolidation between the $0.13 support area and $0.20 resistance.
For now, $0.13 represents the key downside level to watch, while $0.20 remains the main upside obstacle. Holding above support could keep the broader recovery intact and leave another resistance test in play, while losing $0.13 could shift attention toward $0.084 and potentially $0.072 if selling pressure intensifies.
Crypto assets are unregulated, decentralised and highly volatile assets which entail substantial risks and you may lose all invested capital. Refer to the Disclaimers for detailed information on potential risks.