HYPE Price Analysis: Can Hyperliquid Rebound Toward $100?
BITmarkets Team
Oct 14, 2026

With HYPE now trading around $82, the token sits just below a newly formed resistance area. The next move could depend on whether buyers can reclaim this zone or whether selling pressure continues to push the market toward lower liquidity levels.
Hyperliquid (HYPE) technical analysis
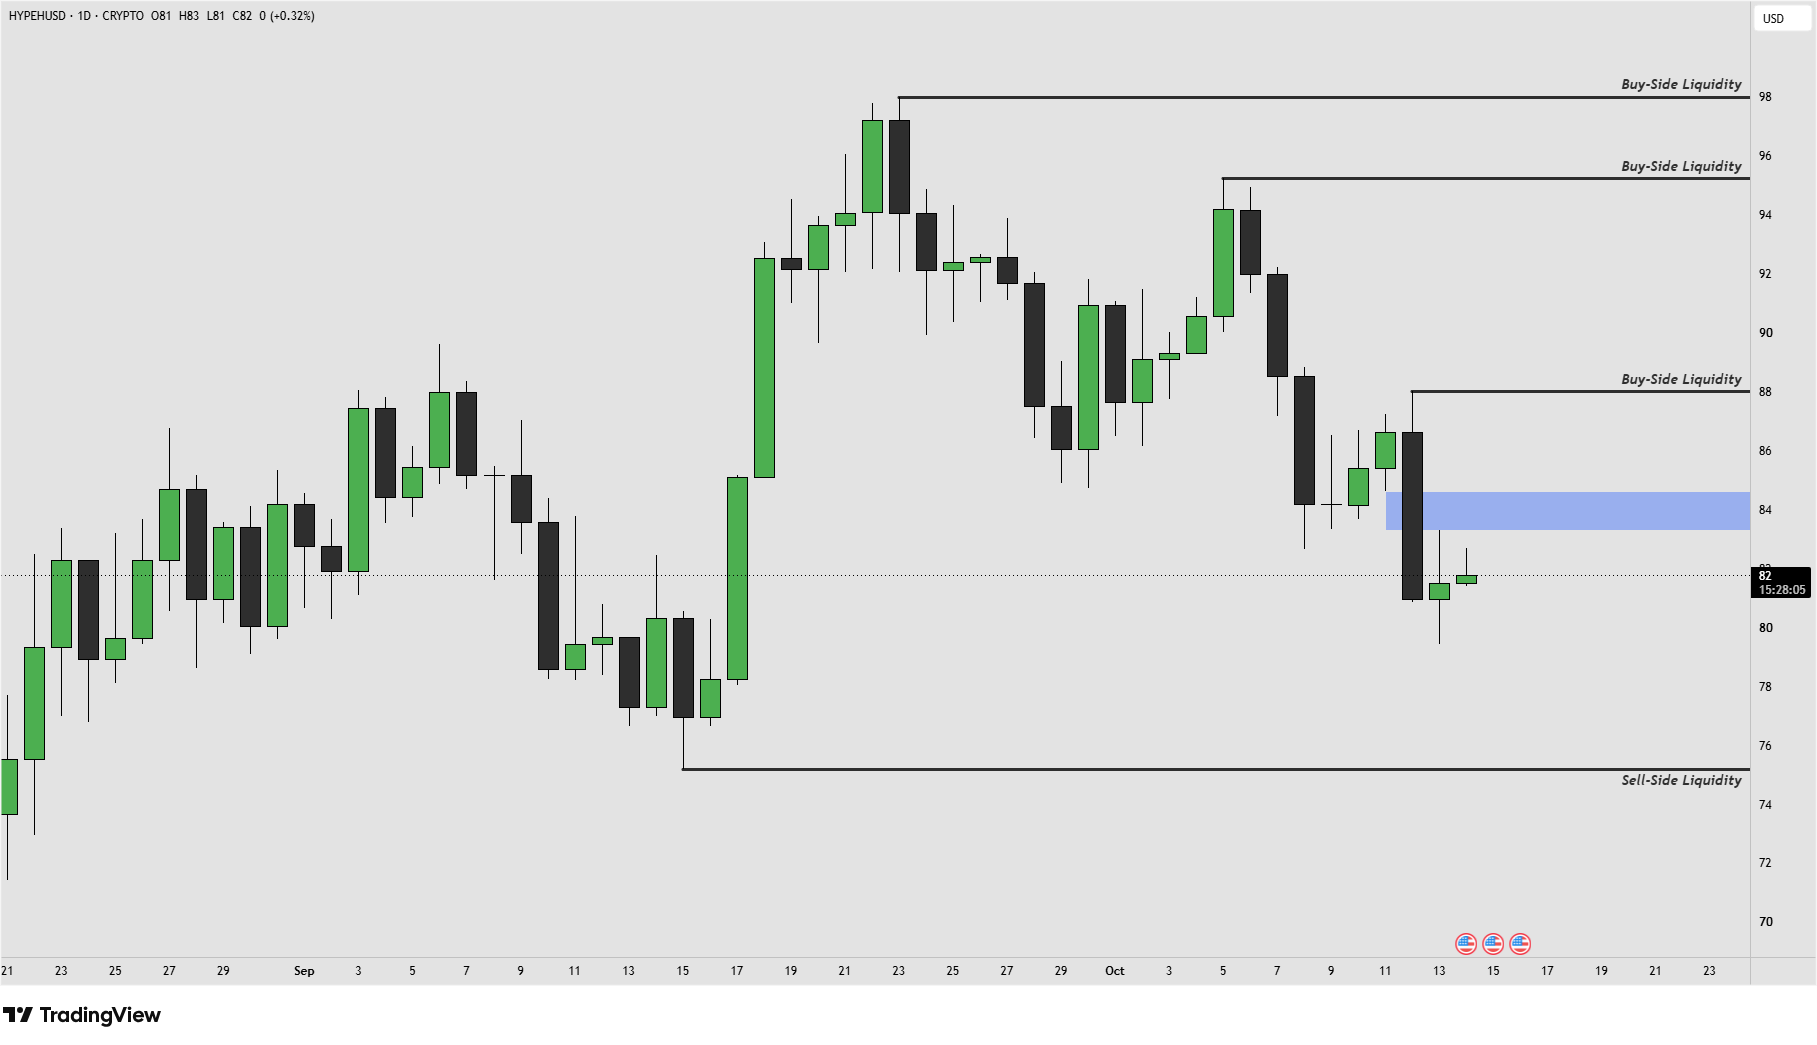
HYPEUSD - 1 Day Time Frame
The latest daily close created a new resistance zone around $83.50–$84.50, which now represents the nearest technical barrier above the current price. With HYPE trading near $82, continued price action below this zone could keep the short-term structure tilted toward the bearish side and leave room for another move lower.
A sustained daily close back above $83.50–$84.50, however, could weaken the current bearish setup and shift attention toward the recent highs again. The main downside reference is the Sell-Side Liquidity area around $75. This level sits below the recent September structure and could become the next important target if selling pressure continues.
The distance between the current price and $75 leaves meaningful room for a deeper correction, making the newly formed resistance zone particularly important for assessing whether sellers remain in control.
Hyperliquid (HYPE) price target
If bearish momentum continues, the main downside target is the Sell-Side Liquidity area around $75. On the upside, Buy-Side Liquidity remains positioned around $88, followed by $95 and $98. These levels could become relevant again if HYPE manages to reclaim the newly created $83.50–$84.50 resistance zone and rebuild bullish momentum.
For now, the technical picture favors caution on the long side. The $83.50–$84.50 area defines the immediate resistance, while $75 represents the main downside liquidity target. A sustained recovery above resistance could improve the short-term structure and bring $88 back into focus first, followed by $95 and $98 if bullish momentum strengthens further.
Crypto assets are unregulated, decentralised and highly volatile assets which entail substantial risks and you may lose all invested capital. Refer to the Disclaimers for detailed information on potential risks.