JUST (JST) Holds Bullish Structure — Can It Push Toward $0.15?
BITmarkets Team
Sep 24, 2026

With the price now approaching $0.110, the current correction places JST at a potentially important decision point. The area combines established support with a key Fibonacci retracement level, making the market's reaction here particularly relevant for determining whether the broader recovery can continue.
JUST (JST) technical analysis
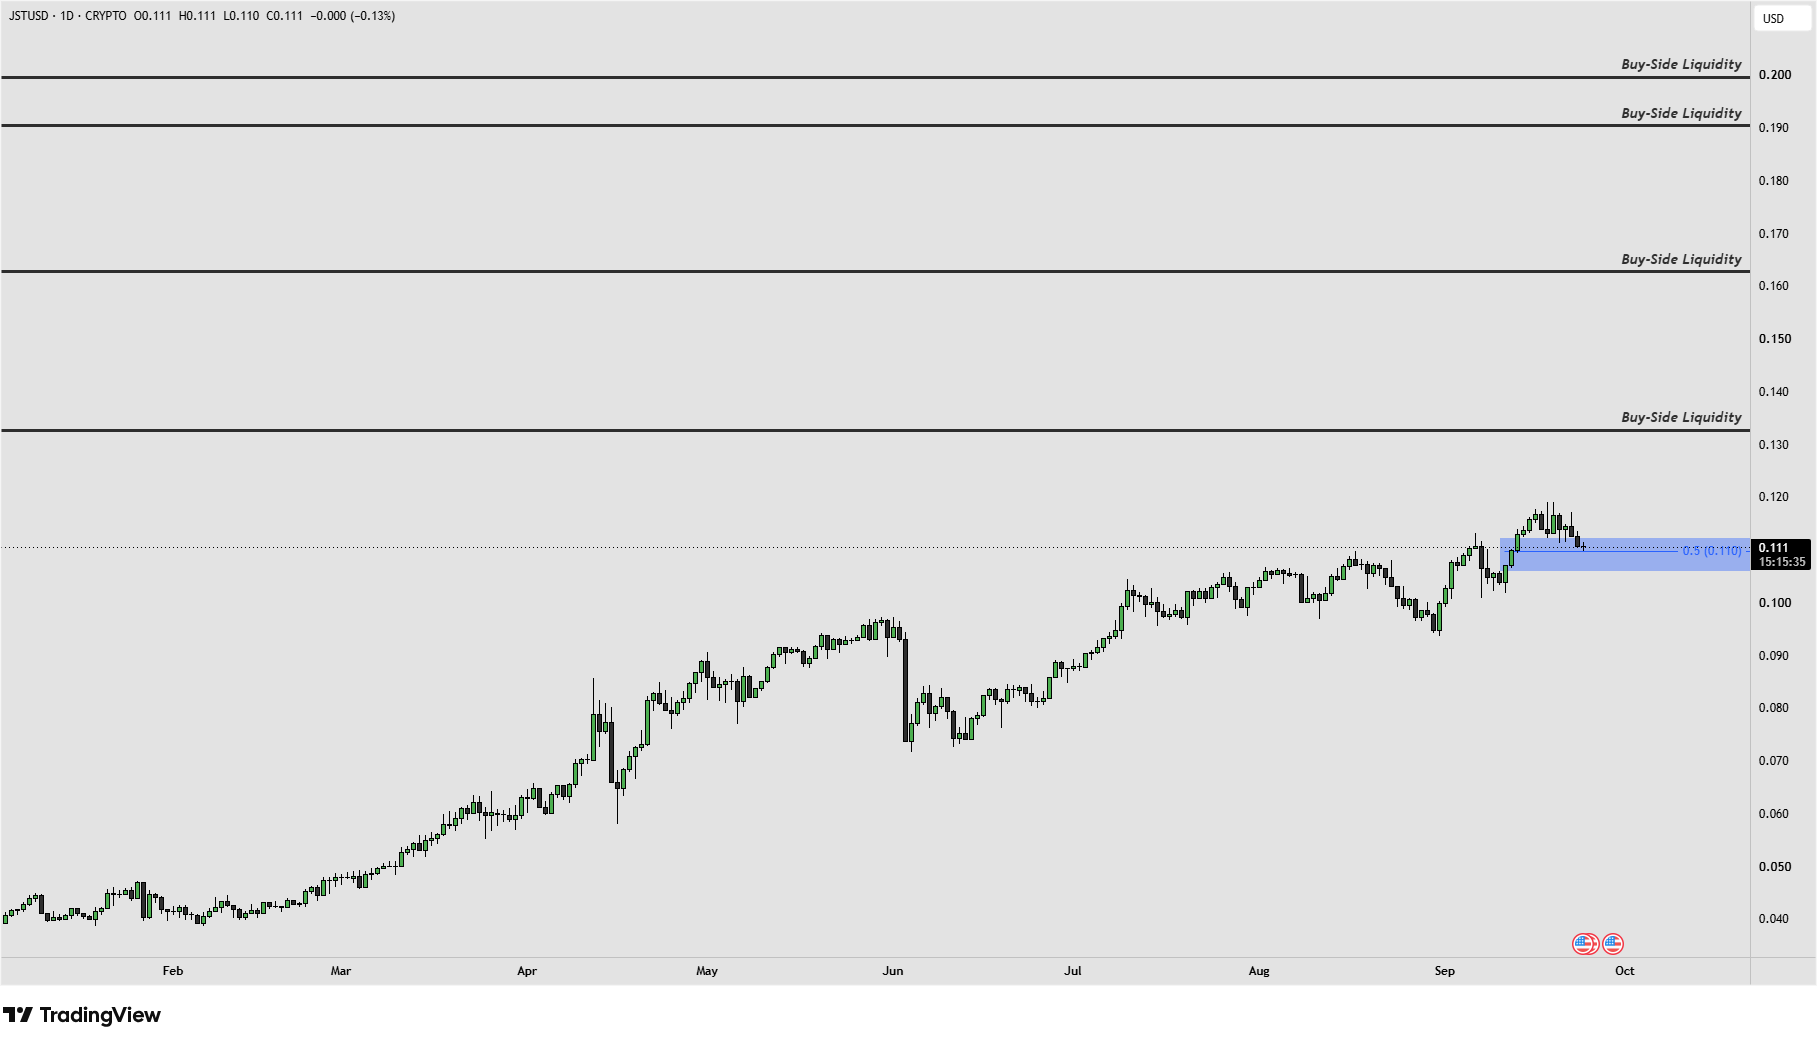
JSTUSD - 1 Day Time Frame
The main support zone is located approximately between $0.107 and $0.112. The 0.5 Fibonacci retracement near $0.110 runs directly through this area, adding further technical significance to the current price region. After reaching its latest high near $0.118, JST has corrected back into this zone without significantly weakening the broader bullish structure. The token is therefore testing an area where renewed buyer interest could begin to emerge.
JST's broader price structure also remains constructive. Following a deeper correction in June, the token recovered and continued forming progressively higher price levels through July, August and September. The latest move above previous local highs further strengthened this pattern and suggests that buyers remain active on the daily timeframe.
A constructive reaction from the $0.107–$0.112 support zone could help preserve the current bullish structure. Conversely, a sustained move below the lower boundary near $0.107 could weaken the latest bullish leg and shift attention toward lower structural support levels.
JUST (JST) price target
If JST stabilizes around the current support area and bullish momentum resumes, the nearest major Buy-Side Liquidity target is located around $0.133. A sustained move beyond this level could shift attention toward the next liquidity area around $0.163. Above that, higher potential targets are located near $0.190 and the psychologically significant $0.200 level.
These areas provide a progression of potential upside targets if the broader bullish structure continues to develop. Given the distance between them, however, periods of consolidation or renewed selling pressure could emerge along the way.
For now, JST is trading at an important technical area. The combination of the $0.107–$0.112 support zone and the 0.5 Fibonacci retracement near $0.110 could provide a potential area for renewed long-side interest if buyers successfully defend it. The nearest upside target remains $0.133, followed by $0.163, $0.190 and $0.200 if bullish momentum strengthens further.
Crypto assets are unregulated, decentralised and highly volatile assets which entail substantial risks and you may lose all invested capital. Refer to the Disclaimers for detailed information on potential risks.