29.05.2025
● اتجاهات
باكستان ستُنشئ احتياطي بيتكوين استراتيجي

اشترِ أكثر من 200 عملة مشفرة.

فتحت BTMT إمكاناتها الكاملة للنمو حيث تم إدراجها رسميًا على أنها عملة مشفرة مستقلة على تبادلنا للشراء والتجارة.

تفخر BITmarkets بدعم رياضيين موهوبين. العمل الجاد غالبًا ما يكون العامل الأكثر أهمية، ومن الرائع دائمًا وجود شخص ما يساندك. نحن نعمل مع بعض من أعظم المواهب في رياضاتهم الخاصة ونساعدهم في رحلتهم نحو المجد والانتصار. هذا هو الهدف الرئيسي الذي نسعى لتحقيقه معًا.
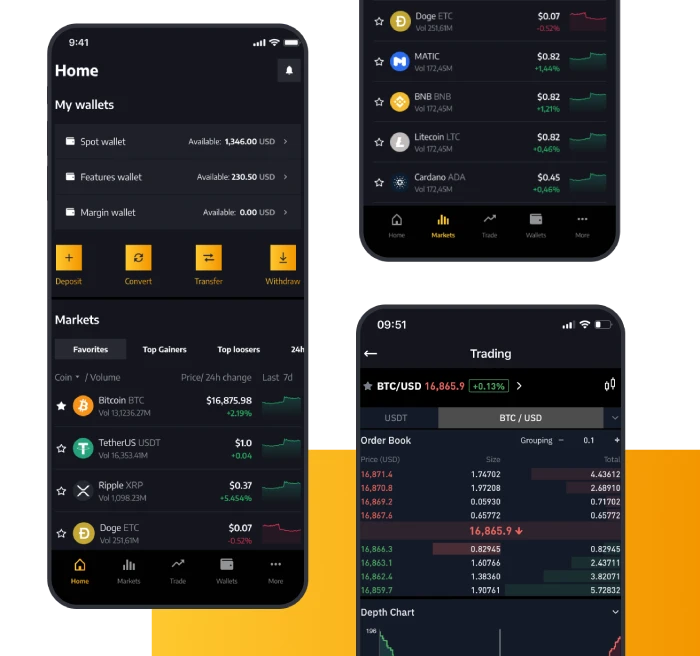
اكتشفلم يكن شراء وبيع العملات الرقمية أسهل من أي وقت مضى. نحن نقدم لك الأدوات اللازمة للتنويع من خلال التداول السهل والسريع والآمن لأكثر من 200 عملة رقمية. هل تشعر بالإرهاق؟ سندعمك كما لم يفعل أي شخص آخر. حرفياً، خطنا متاح بدون توقف باللغة التي تختارها.
تحقق من هويتك لتأمين حسابك والامتثال لقواعد ولوائح اعرف عميلك.
أضف الأموال إلى حسابك بطريقة الدفع التي تختارها واستعد لبدء التداول.
نعم ، الأمر بهذه البساطة حقًا - أنت جاهز تمامًا. استمتع بمجموعة متنوعة من الخيارات للتداول والاستثمار.
أكثر من 99٪ من الأصول مخزنة في المحفظة الباردة والقائمة البيضاء وتأكيدات المعاملات والبيانات الشخصية المشفرة للحفاظ على أصولك آمنة.
تداول في أحد الأسواق الفورية الأكثر تنوعًا. استمتع بتجربة تداول محسّنة مع دفتر الطلبات All-in-One للحصول على سيولة أعمق وفروق أسعار أضيق ومجموعة متنوعة من الأزواج.
أحدثت BITmarkets ترقية futures ثورة في تداول العقود الآجلة للبيتكوين ، مما يتيح هامشًا متعدد الأصول و التسوية. افتح إمكانيات لا مثيل لها مع محفظتك
اختر من بين أكثر من 200 عملة مشفرة مدعومة ،Bitcoin و Ethereum و ChainLink و Dogecoin و Cardano و SHIBA INU بينما تكون دائمًا في طليعة إصدارات العملات الجديدة.
عندما نقول إننا نتحدث العملات المشفرة ، فإننا نعنيها. يعمل خط الدعم الخاص بنا بأكثر من 20 لغة بدون توقف ، لذا كن مطمئنًا أننا نعتني بعملائنا.
انسَ أمر تفويت اللحظة المناسبة لمعاملاتك ، فنحن نتعامل مع أكثر من مليون طلبات في الثانية ، لذلك نقوم بمعالجة تجارتك في اللحظة التي تقرر فيها القيام بذلك .
نحن نجلب العملات المشفرة للجميع. أصبح الشراء والبيع والتداول الآن أكثر بساطة وأمانًا من أي وقت مضى. مع تطبيقنا فائق السرعة ، يمكنك الآن أن تكون دائمًا في صدارة لعبتك.